English | Español
QUICK LINKS
LMI HOMEPAGE
FREQUENTLY USED LINKS
TECHNICAL TOOLS AND STEM
EMPLOYMENT
UNEMPLOYMENT
WAGE
PAID FAMILY AND MEDICAL LEAVE
REPORTS AND RESEARCH
Lincoln County profile
 by Doug Tweedy, regional labor economist - updated March 2022
Overview | Geographic facts | Outlook | Labor force and unemployment | Industry employment | Wages and income | Population | Useful links | PDF Profile copy
Regional context
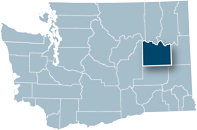
Lincoln County is a rural county at the northern edge of the Palouse wheat-growing region. The economy is dominated by wheat production. The entire northern boundary of the county is a federal Indian reservation and the county seat is in Davenport. The county is the seventh largest in the state, comprising 2,310 square miles.
Next to Whitman County, Lincoln County grows the most wheat in Washington state. Annual wheat production can be over 25 million bushels. One point two million acres of the county’s 1.5 million-acre area is in farmland, and one in every three of those acres is planted in wheat. Lincoln County farmers are very efficient, and 2020 production was good. In the first half of 2020, wheat prices increased which has a large impact on county wholesale sales, retail sales and the overall level of money flowing through the economy.
Livestock production is also an important component of Lincoln County agriculture. A meat packing plant in Odessa has added diversity to agriculture income.
Tourism activities have increased over the last decade as Grand Coulee Dam and the Lake Roosevelt recreation areas have become more developed.
Local economy
Original settlers came to the area seeking gold, and those who settled in the area raised livestock. With the advent of the first railroad in 1881, overall agriculture production focused on wheat. Success in wheat farming eventually drove migration, settlement and development.
Growth in total nonfarm employment has been relatively slow over the last 12 years but had managed to minimize losses during the pandemic.
| Lincoln County | Rank in state | |
| Land area, 2010 (square miles) | 2,310.49 | 7 |
| People per square mile, 2010 | 4.6 | 37 |
Source: U.S. Census Bureau QuickFacts
Schools and government employment constitute almost half of all jobs in the county. In the short term, ongoing budgetary problems are expected to continue to limit overall expansion of government. Lincoln County retail sales improved in 2021. However, even with the increase in total retail sales, overall sales tend to be lower relative to the per capita state average. This reflects the large number of purchases occurring in neighboring Spokane County as county residents travel to shop.
Slow population growth over the last decade limits overall economic growth. This is especially true in many small communities where support for services and the replacement of existing public infrastructure are hampered by a declining population. Overall, the population for the county tends to grow much slower and is older than is typical for the state and nation.
However, population should increase in 2022. The Amazon development in Spokane County is close to the border with Lincoln County and will provide the county new jobs and revenue as Amazon employees discover the low cost of land and housing available in Lincoln County.
Current labor force and unemployment statistics are available on the Labor area summaries page on ESD’s labor market information website.
The average civilian labor force in 2021 increased to 4,729 which compares to 4,680 in 2020. The increase in the labor force was mainly due to more people moving to Lincoln County. A rural county, Lincoln was one of the first counties in the state to enter the phase three business re-openings because of the low incidence of the virus (COVID-19) in the county.
The county unemployment rate in 2021 averaged 4.8 percent, which is a decrease from 2020 (6.7 percent). The unemployment rate fluctuates throughout the year, reflecting seasonal employment, with lows in the summer and highs in the winter.
Source: Employment Security Department/DATA Division
Current industry employment statistics are available on the Labor area summaries page on ESD’s labor market information website.
Lincoln County nonfarm employment averaged 2,610 in 2021 compared to 2,570 in 2020.
- Goods-producing employment averaged 320 in in 2021 an increase of 40 jobs, mainly in the construction industry from 2020.
- Service-providing employment averaged 2,290 in 2021. A slight increase from the 2020 average of 2,280. All the job increases came in the public education sector of government.
- Government employment averaged 1,240 in 2021, an increase from the 2020 average employment of 1,220.
For historical industry employment data, contact an economist.
Source: Employment Security Department/DATA Division
Industry employment by age and gender
The Local Employment Dynamics (LED) database, a joint project of state employment departments and the U.S. Census Bureau, matches state employment data with federal administrative data. Among the products is industry employment by age and gender. All workers covered by state unemployment insurance data are included; federal workers and non-covered workers, such as the self-employed, are not. Data are presented by place of work, not place of residence.
Lincoln County highlights:
The largest job holder group by age in Lincoln County in 2020 was the 55 to 64 cohort with 22.4 percent of the workforce. This group was followed closely by the 45 to 54 cohort at 21.3 percent. In 2020, 50.0 percent of all industry jobs were held by men and 49.9 percent were held by women. Industry differences are discussed below:
- Male-dominated industries included agriculture (77.4 percent), construction (85.6 percent), transportation and warehousing (76.2 percent) and wholesale trade (72.1 percent).
- Female-dominated industries included professional, scientific and technical services (83.5 percent), finance and insurance (80.9 percent), health care and social assistance (75.2 percent), and accommodation and food services (71.3 percent).
Source: Employment Security Department/DATA Division, County Data Tables
In 2020, there were 2,701 jobs covered by unemployment insurance, with a total payroll of $114.6 million.
The county average annual wage was $42,413 in 2020, which is well below the state’s average annual wage of $73,504.
Source: Employment Security Department/DATA Division, County Data Tables
Personal income
Personal income includes earned income, investment income and government payments such as Social Security and Veterans Benefits. Investment income includes income imputed from pension funds and from owning a home. Per capita personal income equals total personal income divided by the resident population.
In 2020, the per capita income was $50,851, which was well below the state’s per capita income of $67,126 and the nation’s per capita income of $59,510.
Median household income over the period 2016 to 2020 was $58,584, well below the state’s $77,006.
Over the period 2016 to 2020, 11.4 percent of the population was living below the poverty level in Lincoln County. This compares to 9.5 percent of the state.
Source: Bureau of Economic Analysis; U.S. Census Bureau
Lincoln County’s population was 11,232 in 2021. An increase from 2020 of 3.3 percent. The increase was due to the Amazon development and low land cost.
The largest city in Lincoln County is Davenport.
Population facts
| Lincoln County | Washington state | |
| Population 2021 | 11,232 | 7,738,692 |
| Population 2020 | 10,876 | 6,705,281 |
| Percent change, 2020 to 2021 | 3.3% | 0.4% |
Source: U.S. Census Bureau QuickFacts
Age, gender and ethnicity
Lincoln County, as a percent, had a much older age demographic than the state or nation in 2021.
- Lincoln County’s population age 65 and older was 25.9 percent in 2021 compared to the state’s 15.9 percent and the nation’s 16.5 percent.
- The youngest age group, under 5 years, was 5.4 percent in 2021 compared to the state’s 6.0 percent.
Within Lincoln County, there is less diversity than the state. White individuals who are not of Hispanic descent made up 93.8 percent of the county’s population compared to 78.5 percent of the state’s population.
Demographics
| Lincoln County | Washington state | |
| Population by age, 2021 | ||
| Under 5 years old | 5.4% | 6.0% |
| Under 18 years old | 21.7% | 21.8% |
| 65 years and older | 25.9% | 15.9% |
| Females, 2021 | 49.1% | 49.9% |
| Race/ethnicity, 2021 | ||
| White | 93.8% | 78.5% |
| Black | 0.6% | 4.4% |
| American Indian, Alaskan Native | 2.0% | 1.9% |
| Asian, Native Hawaiian, & other Pacific Islander | 0.6% | 10.4% |
| Hispanic or Latino, any race | 3.6% | 13.0% |
Source: U.S. Census Bureau QuickFacts
Educational attainment
Over the period 2016 to 2020, 92.9 percent of individuals aged 25 and older were high school graduates. This figure is higher than that of Washington state (91.7 percent) and the nation (88.5 percent).
Over the same period, fewer Lincoln County residents 25 and older have attained a bachelor’s degree or higher (25.4 percent), compared to the state (36.7 percent) and the nation (32.9 percent).
Source: U.S. Census Bureau QuickFacts
- County data tables
- Census Bureau County Profile
- 2020 Census State Profile
- Lincoln County on ChooseWashington.com
- Lincoln County on ofm.wa.gov
- Lincoln County History
- Lincoln County home page
- Lincoln County Economic Development Council
- Self Sufficiency Calculator for Washington State
- Census Bureau QuickFacts
- Lake Roosevelt Recreation Area
- Washington Ports
- Workforce Development Areas and WorkSource Office Directory