English | Español
QUICK LINKS
LMI HOMEPAGE
FREQUENTLY USED LINKS
TECHNICAL TOOLS AND STEM
EMPLOYMENT
UNEMPLOYMENT
WAGE
PAID FAMILY AND MEDICAL LEAVE
REPORTS AND RESEARCH
Klickitat County profile
 by Scott Bailey, regional labor economist - updated July 2022
Overview | Geographic facts | Outlook | Labor force and unemployment | Industry employment | Wages and income | Population | Useful links | PDF Profile copy
Historical and regional context
Klickitat County is located in south central Washington. Since time immemorial it was home to the Klickitat and Wishram tribes, hunter-gatherers who subsisted on elk, salmon, and local roots such as camas and celery. White settlers started pouring into the region in the 1850s. The Klickitat developed a complex relationship with the newcomers, but ultimately, they were forcibly displaced by the territorial governor and the U.S. Army, mostly to the Yakama Reservation, which today comprises the northern edge of Klickitat County. Much of the tribal economic base was destroyed when The Dalles dam was constructed in 1957, raising the water level and destroying Celilo Falls, the major fishing and trading center for indigenous people throughout the region. In 2018, the county was home to an estimated 480 indigenous people, who still celebrate traditions such as the appearance of roots in the spring and the annual return of salmon up the Columbia River. There are longhouses in Rock Creek and Roosevelt.
The economy of the county shifted to farming and timber: sheep and cattle raising, wheat, logging and lumber, then later expanding into orchards, vegetables, aluminum, and now drones and wine. Klickitat County has three distinct economic regions. The western third of the county relies on unmanned aerial vehicle (UAV, a.k.a. drones) production, wood products, and orchards and fruit packing. The eastern third is dominated by vegetable farming, as well as the Roosevelt regional landfill. The central third boasts the county seat, Goldendale, the Maryhill Museum, windsurfing and kite boarding beaches, as well as the now-shuttered aluminum smelter. Vineyards and wineries have been expanding across the county.
Local economy
Nonfarm employment in Klickitat County grew rapidly in the mid-1990s, peaked in 2000, and dropped sharply over the next four years, in large part due to the closure of the Goldendale aluminum smelter in early 2002. A recovery began in 2005 that continued into mid-2009. The Great Recession was short and sharp in Klickitat: employment declined for 12 months (August 2009 to August 2010), falling by 450 jobs (8.0 percent). Recovery finally began in mid-2015, and job growth was extremely strong through the end of 2017, reaching 4.8 percent in 2016 and 4.6 percent in 2017. Employment growth slowed in 2018 and then plunged in early 2019 due to cutbacks in the drone industry. In 2019, the county averaged 6,340 nonfarm jobs, 160 fewer (-2.5 percent) than in 2018. The county lost 620 jobs in April 2020 after the COVID-19 pandemic began, recovering a quarter of those by November.
| Klickitat County | Rank in state | |
| Land area, 2022 (square miles) | 1,871.6 | 16 |
| People per square mile, 2022 | 12.37 | 3 |
Source: U.S. Census Bureau QuickFacts
Job growth in Klickitat County has been highly dependent on manufacturing and specifically the UAV industry – and it’s important to note that there are other important sectors apart from manufacturing. From 2015 to 2018, manufacturing accounted for 670 out of 920 net new jobs in the county. At the end of 2020, factory payrolls were 440 jobs lower than their peak employment in September 2018. Nonmanufacturing employment was growing until COVID-19 kicked in, leading to layoffs in leisure and hospitality and K-12 education. UAVs will continue to play an important role in Klickitat (and in the Columbia Gorge as a whole) going forward, along with agriculture, wood products, and tourism/recreation. Post-COVID-19, the county will likely continue to diversify at a modest pace. Important challenges for the future include securing funding for modernizing the interstate bridge across the Columbia River, and expanding broadband access.
Current labor force and unemployment statistics are available on the Labor area summaries page.
Over the past 25 years, unemployment in Klickitat County has slowly trended lower, as the county economy has become less dependent on resource-based jobs that tend to have large seasonal and cyclical patterns. The gap between the county and the state unemployment rate, which was typically 4 to 6 percentage points in the 1990s, has also closed, and was within a point in 2021. The rate for that year averaged 6.1 percent, only half a point above the lowest rate since the current methodology was adopted in 1990.
Census data suggest that labor force participation rates in Klickitat County have been particularly low, compared with the state and nation. Much of the gap had to do with Klickitat’s older population. However, the labor force participation rate for the prime working-age population (25 to 54) was still substantially lower, as shown in the following table. The low participation rate means the county has relatively fewer wage earners, which affects other economic variables such as household income and personal income.
Source: Employment Security Department
Labor force participation rate for residents aged 25 to 54 years — the prime age working population — for 2015 to 2019
| Group | Klickitat | State | U.S. |
| Total | 68.1% | 78.9% | 78.4% |
| Male | 72.5% | 84.9% | 83.3% |
| Female | 63.4% | 72.7% | 73.4% |
Source: Census Bureau, American Community Survey
In the 2015 to 2019 period, 73 percent of the county’s residents worked at a job in the county. Another 4 percent worked in other Washington counties, while 23 percent who worked in another state were held by county residents – mostly Hood River, Wasco and Multnomah counties in Oregon.
Current industry employment statistics are available on the Labor area summaries page.
Major trends and events over the last 30 years include:
- The expansion of agriculture throughout the county, but especially in vegetable farming and vineyards in east Klickitat and fruit orchards in the western portion.
- The closure of the aluminum smelter in Goldendale in 2001.
- The development of the regional landfill at Roosevelt in 1992 and its subsequent expansion.
- The establishment and expansion of Insitu, a designer and fabricator of unmanned drones, in Bingen, along with a number of its suppliers.
- Layoffs at Insitu and its suppliers in 2019.
Nonfarm employment, January 2000 to June 2022
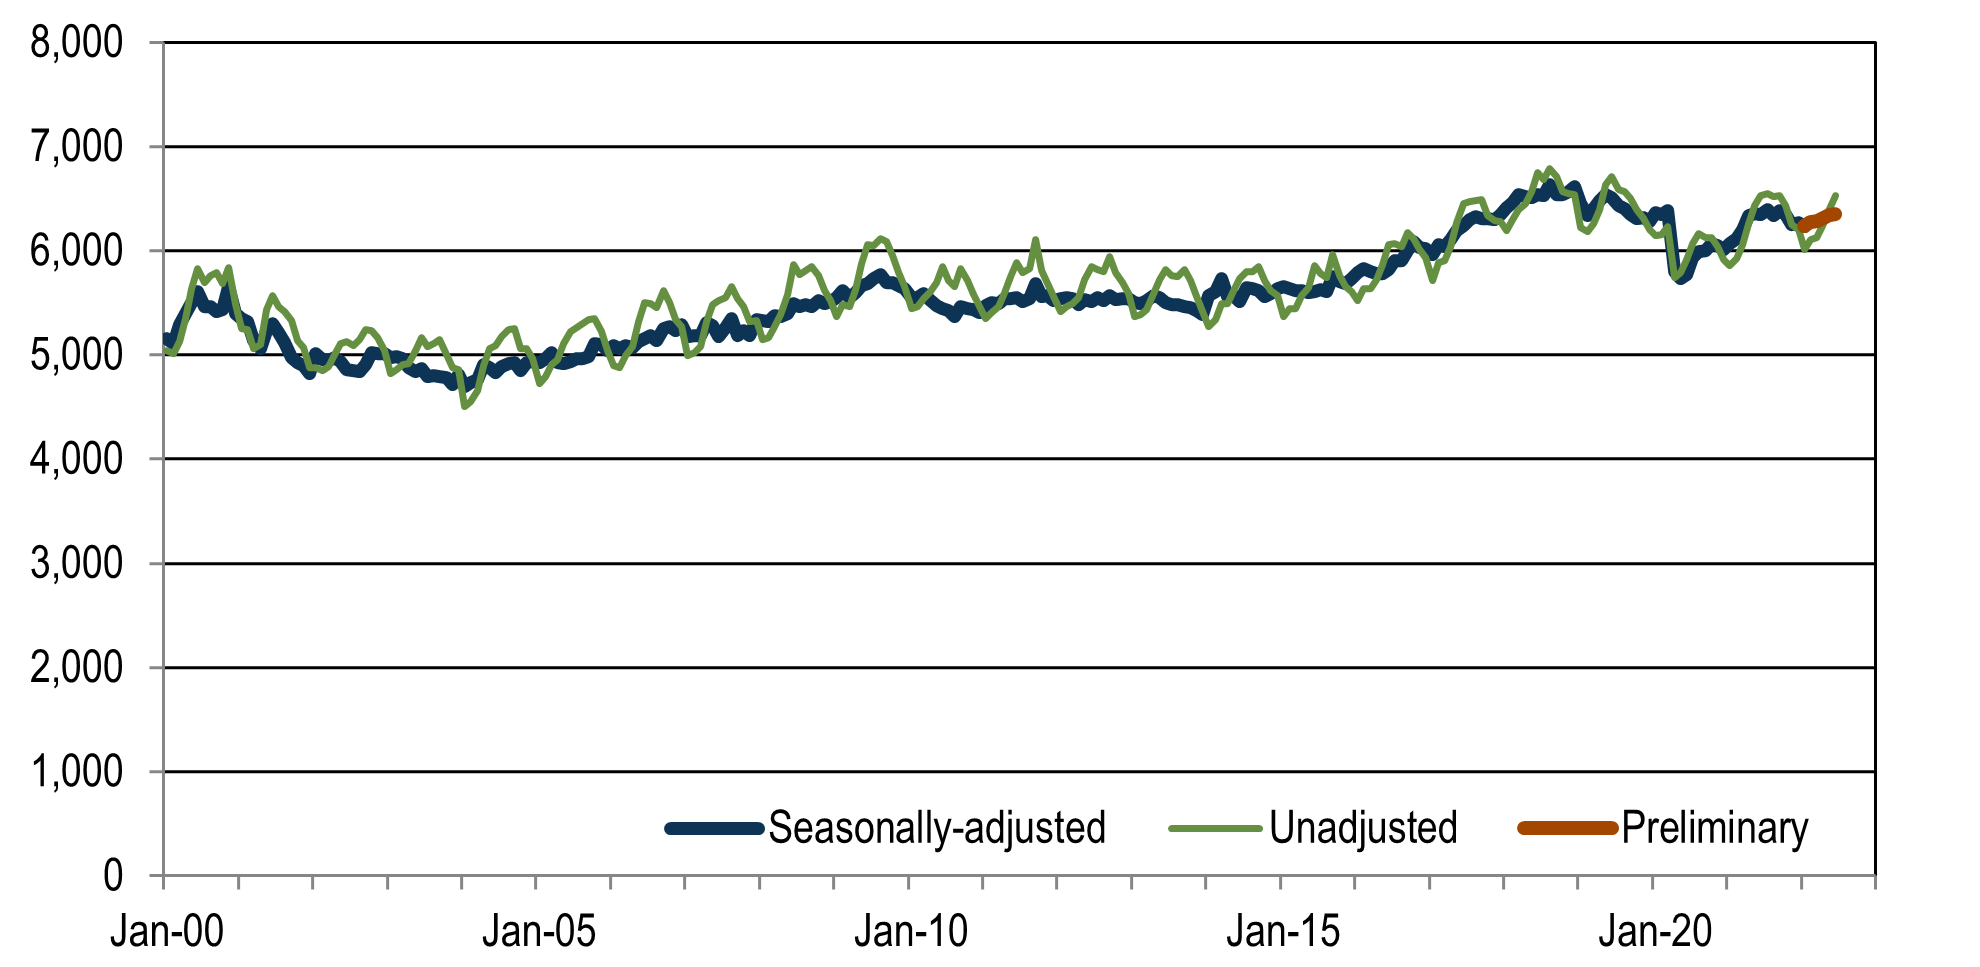
By mid-2022, preliminary estimates showed that in June, the county had 6,530 nonfarm jobs. On a seasonally-adjusted basis, employment was a bit higher than the pre-pandemic level in February 2020, but was 180 jobs or -2.3 percent below the previous peak in June 2019. Several industries had substantial increases over that three-year period, including professional and business services (from 470 to 600 jobs), education and health services (from 390 to 470 jobs) and all other services (which includes information services, financial activities, and other services, from 550 to 620 jobs).
Two industries had major cutbacks. Manufacturing fell from 1,720 to 1,350 jobs, mostly due to reductions in the drone industry and its suppliers. During the pandemic, public sector job counts dropped from 1,860 to 1,730, with most of the loss coming in K-12 public education.
For historical industry employment data, contact an economist.
Agriculture
According to the 2017 Census of Agriculture, there were 750 farms in the county, with a total of more than half a million acres and $99 million in sales. The fruits, tree nuts and berries category accounted for $64 million in sales – the county has extensive production of cherries and wine grapes. There were almost $10 million in sales of cattle and calves, and $8 million in grains, oilseeds, dry beans and dry peas – mostly in wheat.
The agriculture and forestry industry is a major employer in the county, averaging 1,255 jobs in 2021, 17 percent of all jobs. The industry accounted for 13 percent of county personal income in 2020.
Industry employment by age and gender
The Local Employment Dynamics (LED) database is a joint project of state employment departments and the Census Bureau. It matches state employment data with federal administrative data. Among the products is industry employment by age and sex. All workers covered by state unemployment insurance data are included. Federal workers and non-covered workers like the self-employed are not. Data is presented by place of work, not place of residence.
Klickitat County highlights:
- Males held a majority (57 percent) of the jobs in Klickitat County in 2020. The state was much closer to a 52/48 split.
- Female-dominated industries included health care (74 percent), education (68 percent), accommodation and food services (65 percent), and retail trade (52 percent).
- Male dominated industries included construction (82 percent), administration and waste services (78 percent), manufacturing (73 percent) and agriculture and forestry (59 percent).
- The average wage for jobs held by females paid only 66 percent of the average for jobs held by males.
Source: The Local Employment Dynamics
Industry employment by race and ethnicity
The following table shows estimated employment by industry by the race or ethnicity of the worker holding the job. Some takeaways: a majority (57 percent) of jobs held by Latinx were in agriculture (21 percent of all jobs in the county were in agriculture), and another 17 percent were in manufacturing. Jobs held by African Americans were primarily in agriculture (40 percent) and manufacturing (30 percent). Similarly, 38 percent of jobs held by Asian Americans were in agriculture, with 20 percent in manufacturing; and for Indigenous people, 29 percent were in agriculture, 20 percent in manufacturing.
Klickitat jobs by industry and by race/ethnicity of employee, 2020*
| Total* | White Non-Latinx | African American | Native American | Asian American | Pacific Islander | Two or more races | Latinx | |
| Industry | 6,879 | 5,132 | 142 | 111 | 173 | 26 | 165 | 1,251 |
| 11 Agriculture, Forestry, Fishing and Hunting | 1,475 | 632 | 57 | 32 | 67 | 9 | 31 | 708 |
| 21 Mining | 0 | 0 | 0 | 0 | 0 | 0 | 0 | 0 |
| 22 Utilities | 114 | 101 | 0 | 3 | 0 | 0 | 3 | 7 |
| 23 Construction | 271 | 247 | 3 | 2 | 0 | 0 | 6 | 16 |
| 31-33 Manufacturing | 1,568 | 1,235 | 41 | 23 | 36 | 4 | 39 | 213 |
| 42 Wholesale Trade | 132 | 101 | 0 | 4 | 4 | 0 | 6 | 16 |
| 44-45 Retail Trade | 384 | 304 | 3 | 6 | 9 | 5 | 15 | 51 |
| 48-49 Transportation and Warehousing | 110 | 77 | 0 | 0 | 1 | 0 | 1 | 27 |
| 51 Information | 40 | 35 | 0 | 0 | 0 | 0 | 0 | 4 |
| 52 Finance and Insurance | 63 | 55 | 1 | 0 | 0 | 0 | 0 | 4 |
| 53 Real Estate and Rental and Leasing | 36 | 31 | 0 | 0 | 0 | 0 | 0 | 4 |
| 54 Professional, Scientific, and Technical Services | 150 | 133 | 0 | 0 | 5 | 0 | 4 | 8 |
| 55 Management of Companies and Enterprises | 0 | 0 | 0 | 0 | 0 | 0 | 0 | 0 |
| 56 Admin., Support, Waste Mgmt., & Remediation | 306 | 258 | 6 | 6 | 8 | 0 | 11 | 19 |
| 61 Educational Services | 573 | 517 | 4 | 10 | 0 | 0 | 8 | 33 |
| 62 Health Care and Social Assistance | 638 | 529 | 11 | 6 | 18 | 1 | 14 | 61 |
| 71 Arts, Entertainment, and Recreation | 76 | 72 | 0 | 0 | 0 | 0 | 1 | 0 |
| 72 Accommodation and Food Services | 221 | 168 | 1 | 3 | 9 | 0 | 12 | 31 |
| 81 Other Services (ex. Public Administration) | 311 | 268 | 5 | 2 | 4 | 0 | 6 | 29 |
| 92 Public Administration | 385 | 350 | 1 | 8 | 5 | 0 | 6 | 19 |
*Includes all non-federal jobs covered by unemployment insurance, less suppressed industries.
Source: The Local Employment Dynamics Database
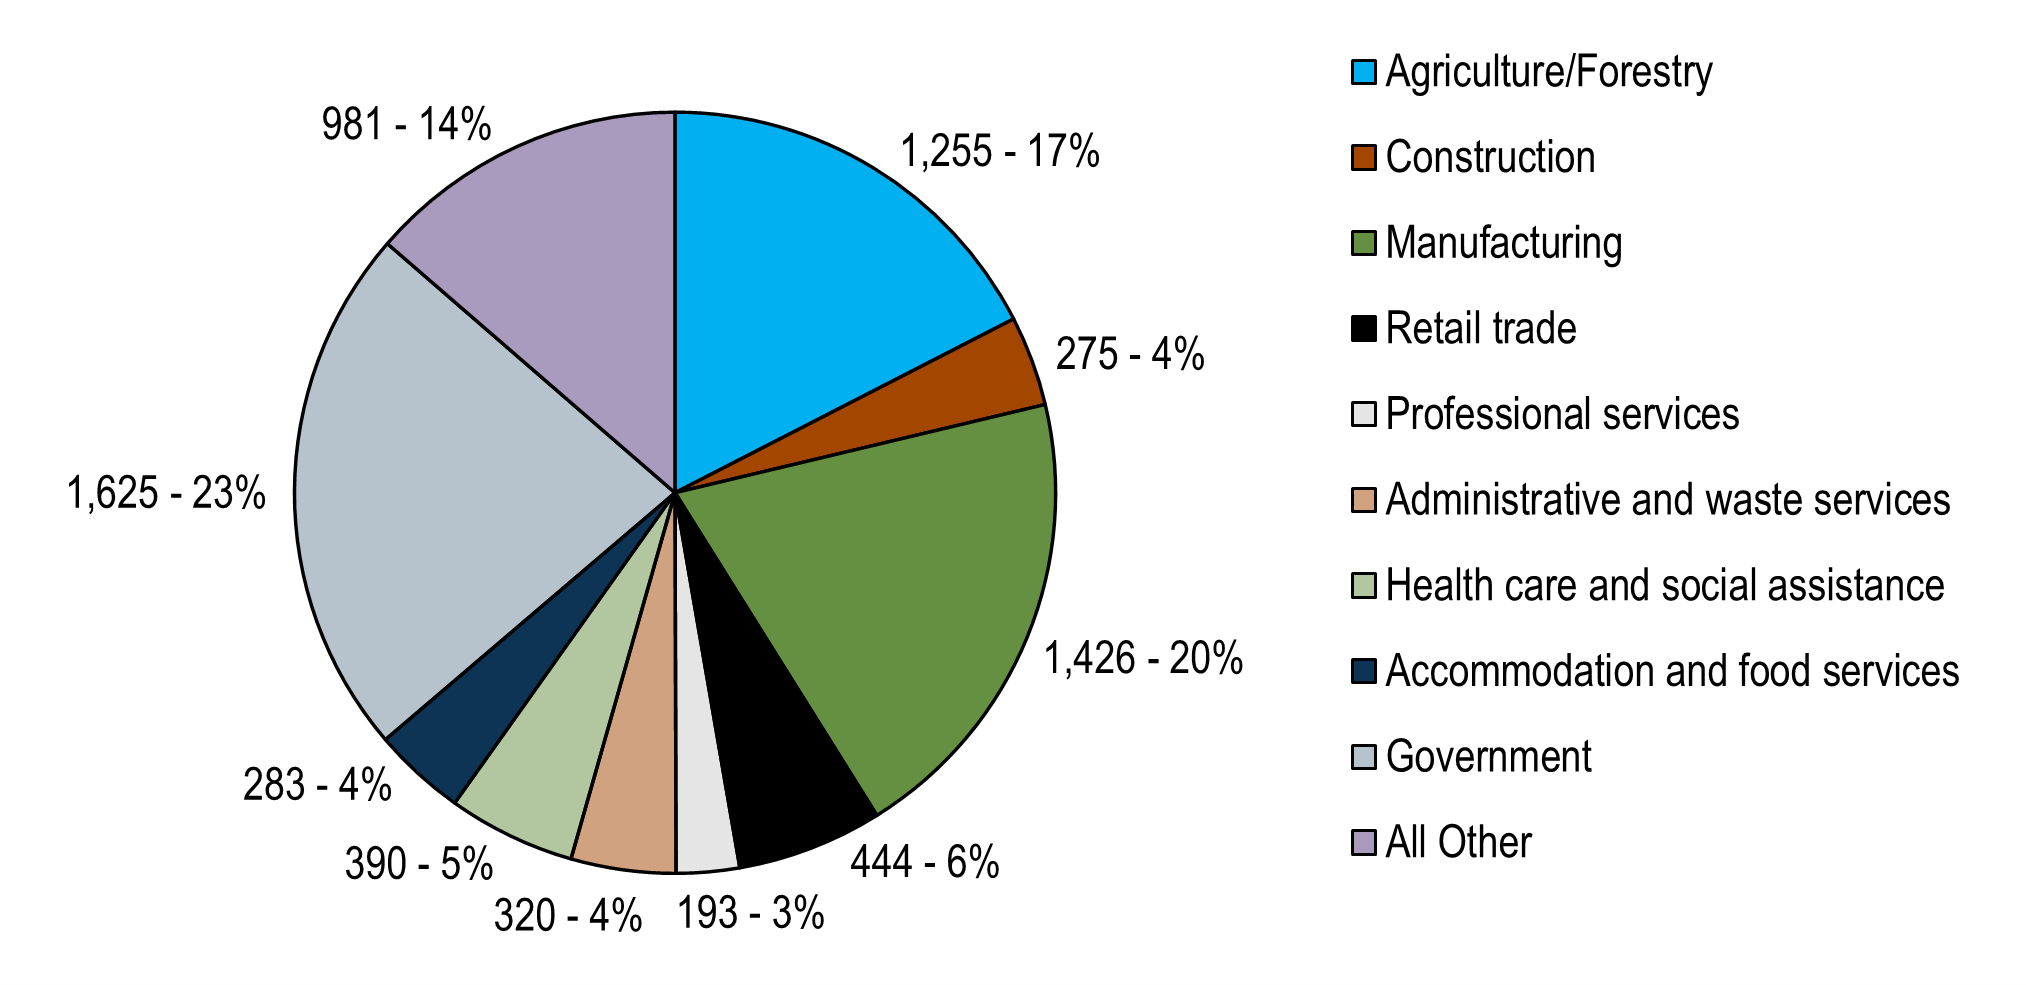
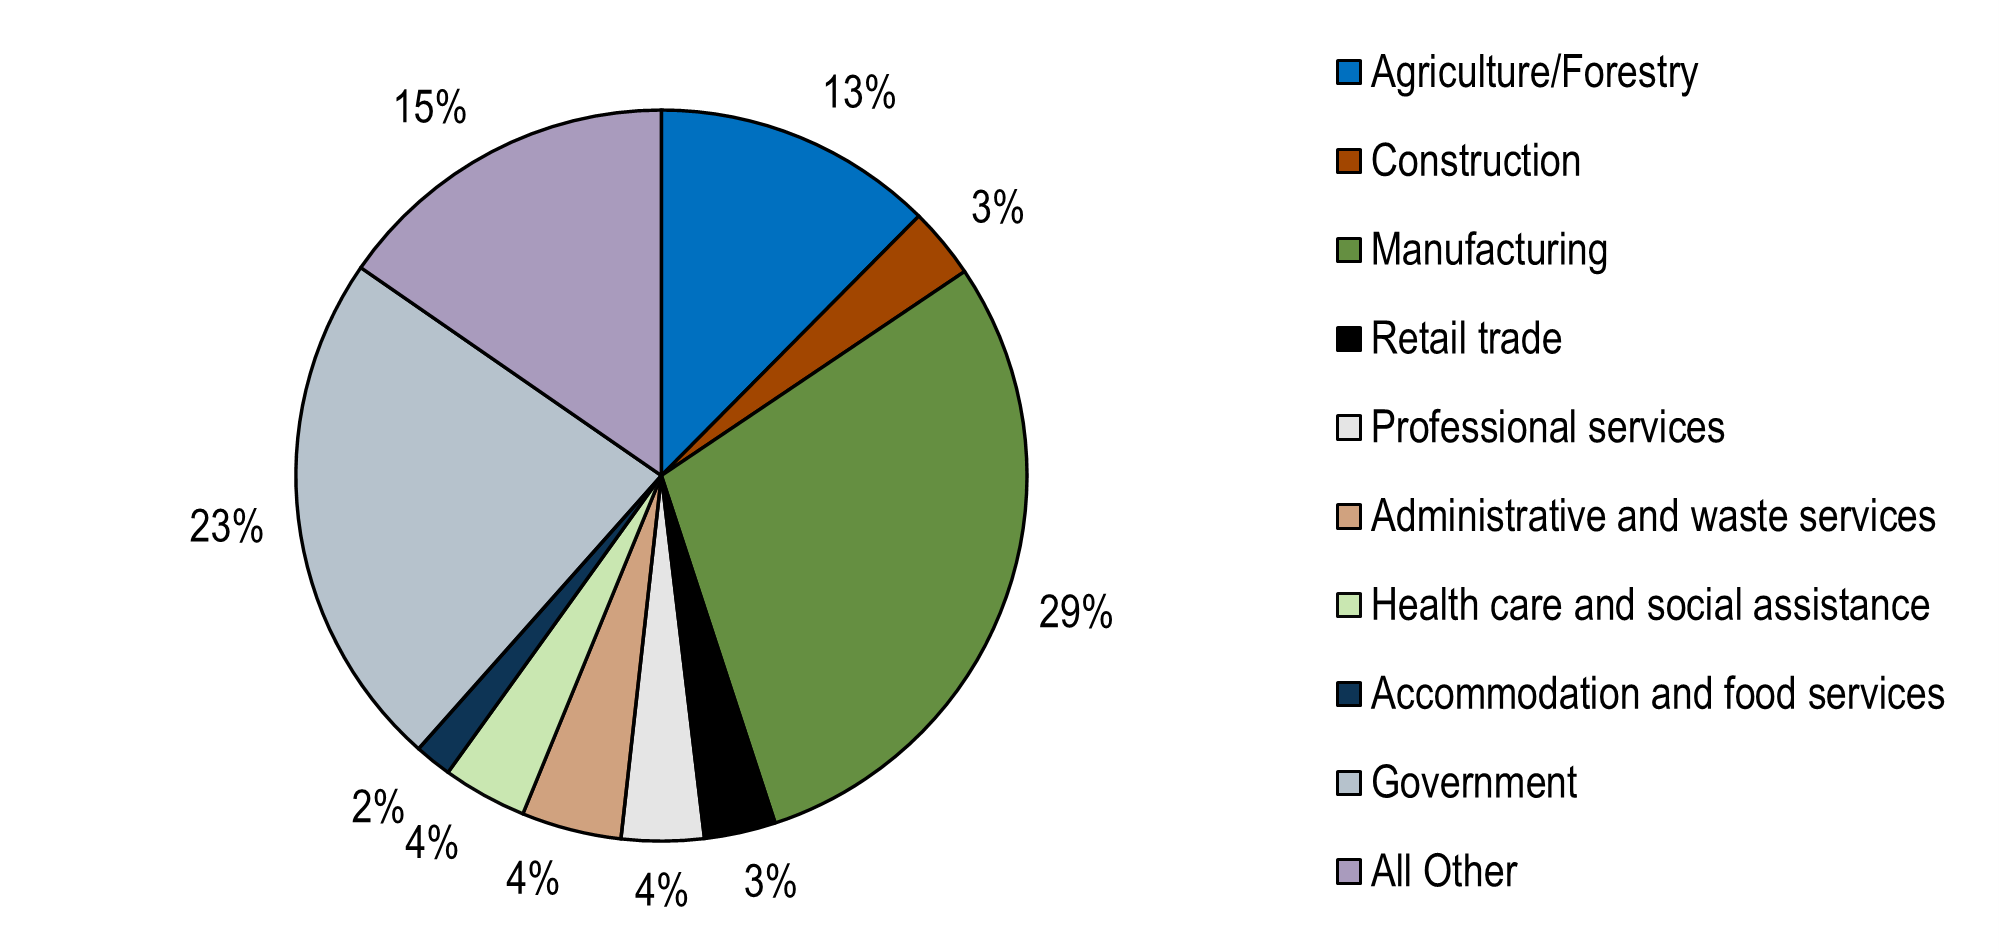
The charts below contrast industry shares of employment and wages covered by unemployment insurance in the county. The biggest difference: manufacturing supplied 22 percent of the jobs in the county, and 35 percent of total wages. The average wage for all jobs in the county was $52,071, for manufacturing: $82,075. The county’s average wage had been trending up over time, in line with the average for the rest of the state if King County is excluded, until 2019, when job losses in manufacturing led to a 2.9 percent drop in the average wage for all industries.
Covered employment in 2021
Covered wages in 2021
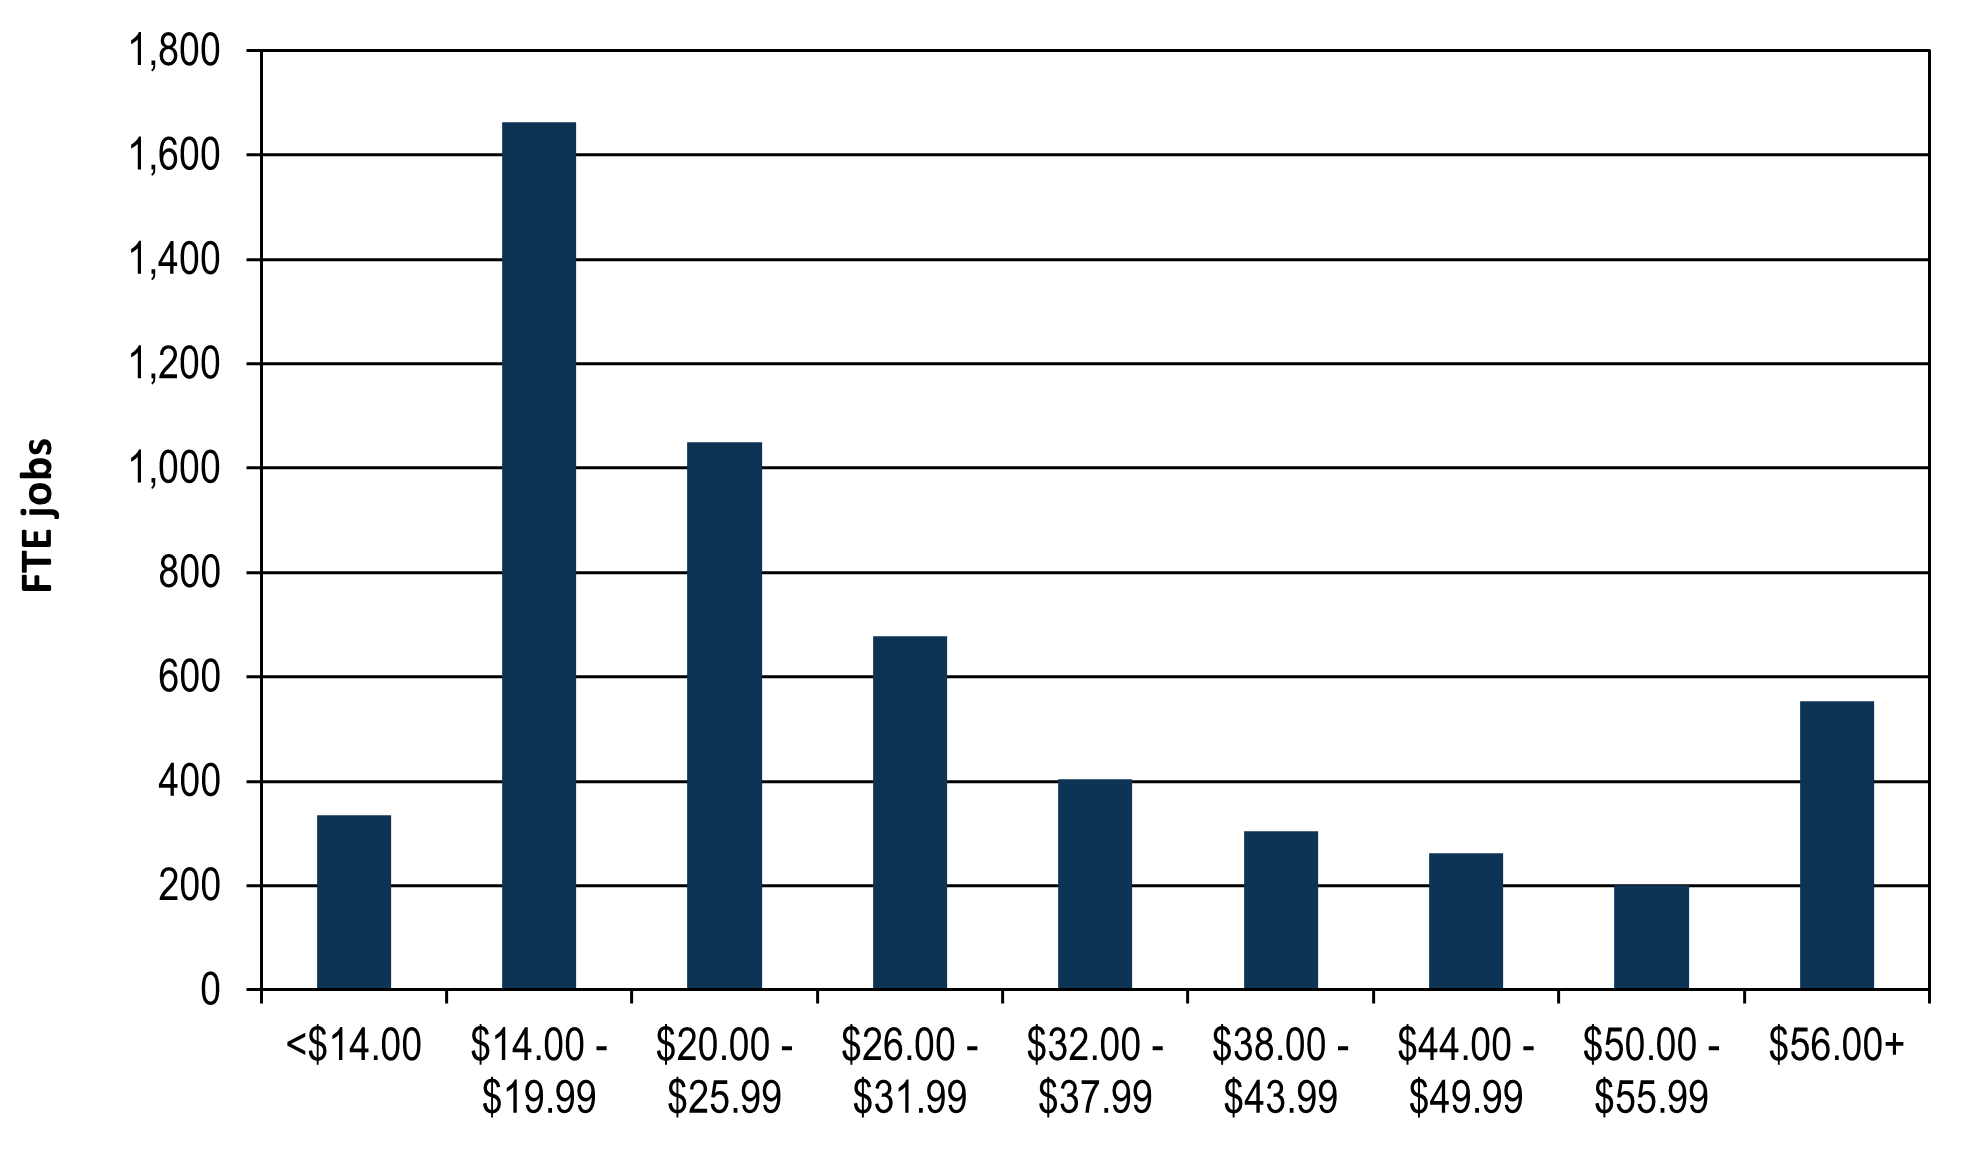
The median hourly wage for non-federal jobs in Klickitat County was $25.31 in 2021. In comparison, the state median was $30.50 ($25.81 if King County was excluded). The 2021 median was 5.1 percent above the 2019 figure, a solid increase through the pandemic years.
In 2021, 32 percent of the jobs in Klickitat paid below $20 per hour versus 24 percent statewide and 31 percent for the state when King County is excluded. Many of these lower-wage jobs were in agriculture and forestry (38 percent), along with retail trade (14 percent) and local government (12 percent). On the upper end, more than a third of the jobs in the county paid $32.00 per hour or more, slightly less than the 37 percent for non-King counties, and further below the 47 percent at the state level. These higher-wage jobs come primarily from two industries: manufacturing (38 percent) and local government (24 percent).
Full-time employment (FTE) jobs by hourly wage range, 2021
Since 2010, there has been a marked shift to higher-income jobs. Partly, that has been due to the increase in the minimum wage, which has pushed some lower-wage jobs above the $14.00 per hour threshold. There has also been a net gain in the number of jobs in higher wages as well.
Change in FTE jobs by hourly wage range, 2010 to 2021

Finally, the following table shows the average monthly wage for jobs in Klickitat County by the race or ethnicity of the job holder. The relatively high wages for jobs held by African Americans stemmed from their concentration in the transportation manufacturing industry.
2020 average monthly earnings by race/ethnicity of job holder*
| Race/ethnicity | Number of jobs | Average monthly wage | Percent of total |
| All Workers | 5,884 | $4,578 | 100% |
| White Non-Latinx | 4,464 | $4,811 | 105% |
| African American | 113 | $5,039 | 110% |
| Indigenous | 89 | $4,073 | 89% |
| Asian American | 146 | $3,953 | 86% |
| Pacific Islander | 20 | $3,793 | 83% |
| Two or more races | 144 | $4,530 | 99% |
| Latinx | 1,006 | $4,364 | 79% |
*Includes all non-federal “full-quarter” jobs covered by unemployment insurance. “Full-quarter” jobs are jobs held by the employee at an employer in the current quarter that existed in the previous quarter and persisted into the next quarter.
Source: Employment Security Department/DATA Division; Bureau of Labor Statistics; Bureau of Economic Analysis; U.S. Census Bureau; U.S. Census Bureau, American Community Survey
Personal income
Personal income includes earned income, investment income, and government payments such as Social Security and Veterans Benefits. Investment income includes income imputed from pension funds and from owning a home. Per capita personal income equals total personal income divided by the resident population.
Per capita income declined slightly to $51,973 in 2020. Over the past dozen years, Klickitat has moved from 78 percent of the national average to 87 percent, and from 72 percent of the state average to 77 percent. Earned income, investment income, and transfer payments have all grown faster at the county level than for the state and nation.
Beginning in 1990, an increasing share of income earned by Klickitat residents came from jobs held outside the county. The percent of earned income coming from cross-county commuters increased from 15 percent in 1990 to 29 percent in 2009 before declining and stabilizing around 22 percent over the past seven years. Meanwhile the percent of earnings from jobs within the county that was earned by non-county residents has risen sharply from 14 percent in 2006 to 20 percent in 2020.
Transfer payments are an important source of income for county residents, and especially so in 2020 during the pandemic. Transfers jumped from 28 percent of total income to 31 percent in that year, with unemployment insurance benefits and stimulus payments providing most of the increase. On a per capita basis, payments were 24 percent higher in Klickitat than nationally, due to factors like a more elderly population, poverty, and a higher population of veterans.
Per capita transfer payments, 2020
| Transfer Payments | U.S. | State | Klickitat |
| Total benefits | $12,872 | $12,112 | $15,980 |
| Social Security benefits | $3,272 | $3,272 | $4,827 |
| Medicare benefits | $2,486 | $2,008 | $3,099 |
| Public assistance medical care benefits | $2,035 | $1,814 | $3,044 |
| Income maintenance benefits | $918 | $771 | $1,063 |
| Supplemental Security Income (SSI) benefits | $176 | $137 | $214 |
| Supplemental Nutrition Assistance Program (SNAP) | $254 | $226 | $301 |
| Unemployment insurance compensation | $1,630 | $1,599 | $862 |
| Veterans benefits | $442 | $526 | $799 |
| Refundable tax credits (e.g., stimulus payments) | $1,232 | $1,100 | $1,232 |
| All other benefits | $783 | $1,062 | $1,053 |
Household income
Recent estimates of household income from the Census Bureau showed that median household income in Klickitat County has increased considerably of late. The median for the five years spanning 2015 to 2019 was $55,773, an increase of 13 percent from the 2010 to 2014 period. That was a smaller increase than the state (14 percent) but larger than the nation (10 percent).
Poverty in Klickitat County was estimated at 15.6 percent for the 2015 through 2019 time span, identical to the previous five years. The county’s rate was more than two points higher than the national average (13.4 percent) and almost five points above the state (10.8 percent).
It seems reasonable to conclude that the lower median income in the county is connected with the higher level of lower-wage jobs. A challenge for the county is to facilitate the development of more middle-income jobs to help lower poverty – no easy task these days.
Klickitat County’s population was estimated at 23,150 in 2022. Of note:
- Over the past decade, the county has grown at an average of 1.1 percent per year, faster than the average for rural counties in the state (0.7 percent) and for the nation (0.6 percent) and slower than for the state overall (1.4 percent).
- Net in-migration has accelerated over the past few years, from only 17 net new residents in 2009 to 2010 to an average of over 300 a year for 2017 to 2022. Historically, most newcomers come from nearby counties and Puget Sound, while Wasco and Deschutes counties in Oregon were the top destinations for those who moved out of the county.
Population facts
| Year | Klickitat County | Washington state |
| Population 2010 | 22,318 | 6,724,540 |
| Population 2022 | 23,150 | 7,864,400 |
| Percent change, 2010 to 2022 | 13.9% | 17.0% |
Source: Washington Office of Financial Management
Age, gender and ethnicity
Klickitat’s population is somewhat older than the state and nation. In 2021:
- Population below the age of 20 in Klickitat county was 22 percent, versus 24 percent statewide.
- Population aged 20 to 39 was 19 percent, versus 28 percent statewide.
- Population aged 40 to 59 was 25 percent, similar to the state figure of 25 percent.
- Population aged 60 or older was 34 percent, far more than the state average of 24 percent.
The county is also less diverse: in 2021, 78 percent of the population was white and non-Hispanic, compared to 64 percent statewide.
Source: Office of Financial Management
Demographics
| Klickitat County | Washington state | |
| Population by age, 2021 | ||
| Under 20 years old | 21.7% | 24.1% |
| 29 to 39 years old | 18.7% | 27.5% |
| 40 to 59 years and older | 25.4% | 24.8% |
| 60 years and older | 32.2% | 23.6% |
| Population by race/ethnicity, 2021 | ||
| White alone, not Hispanic or Latino | 78.1% | 63.7% |
| African American | 0.5% | 4.3% |
| American Indian, Alaskan Native | 2.7% | 1.9% |
| Asian-American | 0.7% | 9.9% |
| Native Hawaiian, other Pacific Islander | 0.2% | 0.9% |
| Multi-racial | 8.5% | 10.2% |
| Hispanic or Latino, any race | 13.3% | 14.0% |
Source: Office of Financial Management
Educational attainment
For the 2016 to 2020 period, an average of 26 percent of the Klickitat population aged 25 and older had a bachelor’s degree or higher education, up from 19 percent in the 2011 to 2015 span. The 7 percent increase was twice that of the state and nation, though the level still lagged the 35 percent statewide and 32 percent nationally.
Source: U.S. Census Bureau
- County data tables
- Census Bureau County Profile
- 2020 Census State Profile
- Goldendale area Chamber of Commerce
- Klickitat County on ofm.wa.gov
- Klickitat County home page
- Klickitat County History
- Klickitat County on ChooseWashington.com
- Mount Adams Chamber of Commerce
- Port of Klickitat
- U.S. Census Bureau QuickFacts
- Self Sufficiency Calculator for Washington State
- South Central Workforce Council
- WorkSource Office Directory