English | Español
QUICK LINKS
LMI HOMEPAGE
FREQUENTLY USED LINKS
TECHNICAL TOOLS AND STEM
EMPLOYMENT
UNEMPLOYMENT
WAGE
PAID FAMILY AND MEDICAL LEAVE
REPORTS AND RESEARCH
Kittitas County profile
 by Don Meseck, regional labor economist - updated July 2022
Overview | Geographic facts | Outlook | Labor force and unemployment | Industry employment | Wages and income | Population | Useful links | PDF Profile copy
Regional context
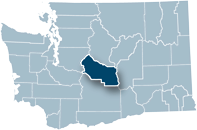
Kittitas County is in the center of the state, 100 miles east of Seattle across the Cascade Mountain Range. The county is bordered by Chelan, Grant and Yakima counties. With 2,297.3 square miles, it is one of the largest counties in the state. Over two-thirds of its area is hilly and mountainous, making it sparsely populated with 19.3 persons per square mile compared to 115.9 in Washington state in 2020.
Local economy
Native American inhabitants in the Kittitas Valley date back over 300 years in official records. The forerunners of the contemporary Yakama Nation occupied the land along the Yakima River, including the Kittitas Valley. The 1840s saw an influx of Euro-American settlers who brought measles and other diseases deadly to the indigenous population. The Treaty of 1855, following the Cayuse Indian War, resulted in the tribes moving to the Yakama and Colville Reservations. The 1883 Washington Territorial Legislature split off the northern part of Yakima County and recognized it as Kittitas County.
Early settlers engaged in livestock raising, crop farming, dairying, logging and lumber processing and mining. Irrigation promoted an expansion in agriculture and food processing. By 1950, agriculture was a major sector in employment and income. By the 1960’s, the horse industry, including horseracing, showing and recreation horses, increased the demand for hay. Many ranchers switched to hay and grain production as feed costs rose and price controls limited beef profitability.
Today, timothy hay is a major Kittitas County cash crop. Timothy hay is grown primarily for the export market and is the single-largest agricultural product produced in Kittitas County. Roughly 90 percent of the timothy hay crop is exported overseas to Japan, South Korea, United Arab Emirates, Vietnam, and other Pacific Rim countries, with Japan being the single-largest export customer.
Central Washington University (CWU) is the largest employer in Kittitas County. According to the City of Ellensburg’s Comprehensive Plan (amended on December 20, 2021): “Central Washington University (CWU) is an important and vital force in the community. CWU's campus occupies more than 380 acres and employs about 1,800 people. In spring 2017, the Ellensburg campus enrollment was about 9,600 students. The $113 million annual payroll supports retail, housing and entertainment businesses. CWU spends nearly $15 million (annually) in the area with vendors for everything from catering to furniture. Construction spending of nearly $500 million since 2010 has supported employment throughout the region and built one of the most beautiful and modern campuses in the state.”
Nestled between the Cascade Mountains in the West and the Columbia River in the East, Kittitas County is surrounded by natural beauty. This sunny agricultural region provides perfect conditions for biking, hiking, fishing, and a host of other outdoor activities along with a year-round calendar of festivals and events.
| Kittitas County | Washington state | |
| Land area, 2020 (square miles) | 2,297.3 | 66,455.1 |
| People per square mile, 2020 | 19.3 | 115.9 |
Source: U.S. Census Bureau QuickFacts
Current Employment Statistics (CES) data show that, year over year, total nonfarm employment in Kittitas County retrenched in each of the 12 months from April 2020 through March 2021 before expanding for 14 months (April 2021 through May 2022). Local Area Unemployment Statistics (LAUS) data show that although the county's Civilian Labor Force (CLF) has grown year over year from May 2021 through May 2022, growth rates have generally decelerated from January through May 2022. Hence, it is uncertain how long this economic resurgence will last. Much depends on whether the COVID-19 virus can be contained and/or eradicated. Also, the effect of rising interest rates on housing markets are a concern. Nevertheless, staff in the Data Architecture, Transformation and Analytics (DATA) Division of the Washington State Employment Security Department (ESD) prepared long-term (i.e., 10-year) industry employment projections indicating a 0.1 percent average annual nonfarm growth pace from 2019 to 2029 for the four-county (Kittitas, Klickitat, Skamania, and Yakima) South Central Workforce Development Area (WDA), and a 0.4 percent growth rate for Washington state.
Current labor force and unemployment statistics are available on the Labor area summaries page.
Following the national recession which occurred from December 2007 through June 2009, the average annual, not seasonally adjusted unemployment rate in Kittitas County rose to an apex of 9.8 percent in 2010. (The average annual unemployment rate in Washington state also reached its zenith in 2010, at 10.0 percent.) Kittitas County’s unemployment rates then fell for seven consecutive years (from 2011 to 2017, inclusive) to an average of 5.2 percent in 2017. This 5.2 percent reading in 2017 was the lowest average annual unemployment rate in Kittitas County since electronic records were implemented by ESD in 1990. Local rates edged upwards a bit in 2018 (to 5.4 percent) and in 2019 (to 5.5 percent) before increasing to 8.9 percent in Kittitas County and 8.5 percent across Washington state in 2020, due to COVID-19-related layoffs, but these rates were still lower than during the Great Recession. Kittitas County’s unemployment rate dropped to 6.3 percent in 2021 while Washington’s 2021 average rate was 5.2 percent. But average annual CLF data paint a more negative picture of the local labor market. Kittitas County averaged 22,318 residents in the CLF in 2020 but only 22,027 in 2021, a -1.3 percent contraction.
Monthly CLF estimates portray a slightly better view of the local economy. The Kittitas County labor force recovered (year over year) in every month from May 2021 through May 2022. Although this is a positive, labor force growth rates have been decelerating from January through May 2022 – a trend to watch in forthcoming months. In May 2022, there were 46 more residents in the labor force than in May 2021, a modest 0.2 percent upturn. Also, current LAUS estimates indicate a slightly more rapid resident employment growth pace of 0.7 percent between May 2021 and May 2022 – a bit faster than the CLF growth rate of 0.2 percent during this period. This likely indicates not only that more residents were employed this May than in May 2021, but that a greater ratio of these residents commuted or teleworked to jobs outside of Kittitas County. Finally, the number of unemployed dropped by -7.5 percent, from 1,271 in May 2021 to 1,176 in May 2022. The decrease in the number of unemployed coupled with the labor force expansion caused the unemployment rate to fall from 5.8 percent in May 2021 to 5.3 percent in May 2022. Nevertheless, the Kittitas County labor force was still smaller in May 2022 than in May 2019. The CLF this May (22,058 residents) was 2,448 residents (-10.0 percent) below the 24,506 residents in the labor force back in May 2019, during the “pre-COVID-19 days.”
Source: Employment Security Department/DATA Division, County Data Tables
Current industry employment statistics are available on the Labor area summaries page.
The analysis in the first part of this section is derived primarily from Quarterly Benchmarked (WA-QB) data. One advantage of these data is that the employment information is very current, and data are updated monthly using WA-QB employment estimates. However, estimates are nonfarm related – they do not include agricultural employment figures.
The analysis in the second part of this section is derived from the Bureau of Labor Statistics’ QCEW program, conducted by ESD. Although it takes a little longer to acquire QCEW data (than WA-QB data), the economic information provided is broader and more detailed than that which is provided by WA-QB data.
First, QCEW includes employment, wage and size of firm figures for the agricultural sector, which WA-QB does not include. Second, QCEW data provides employment, wage and size of firm figures for businesses and government organizations in Kittitas County down to the three-digit NAICS sub-sector level (i.e., more detail than WA-QB). QCEW data include agricultural and nonagricultural employment and wages for firms, organizations and individuals whose employees are covered by the Washington State Employment Security Act. Also included are data for federal government agencies covered by Title 5, U.S.C. 85. Covered employment generally exceeds 85 percent of total employment in the state of Washington.
Types of jobs not covered under the unemployment compensation system, and hence not included in QCEW data, include casual laborers not performing duties in the course of the employer’s trade or business; railroad personnel; newspaper delivery people; insurance or real estate agents paid on a commission basis only; non-covered employees working for parochial schools, religious or non-profit organizations; employees of sheltered workshops; inmates working in penal institutions; non-covered corporate officers; etc.
Analysis using Quarterly Benchmarked data:
Following is a summary/analysis of average annual local nonfarm employment trends in Kittitas County in 2019, 2020, and in 2021:
- In 2019 – Nonfarm employment in Kittitas County averaged 17,570, a modest 200 job and 1.2 percent upturn over the 17,370 jobs tallied in 2018. This 1.2 percent annual increase was slower than the state’s 2.0 percent job-growth rate during 2019. State and local government education increased by 90 jobs (up 1.8 percent) rising from an average of 5,000 jobs in 2018 to 5,090 in 2019. The industry adding the second-highest number of jobs in 2019 was construction which advanced by 4.8 percent and 50 jobs, from 1,050 in 2018 to 1,100 in 2019. On the downside, information and financial services contracted from 620 to 600 jobs (down 3.2 percent) in 2019. Washington’s economy saw employment expand by 2.0 percent in 2019, the ninth year of recovery, as job numbers rose by 66,700 with nonfarm employment averaging 3,467,800 versus 3,401,100 jobs in 2018.
- In 2020 – This was a dismal year for the Kittitas County nonfarm market due to COVID-19-related layoffs. Nonfarm employment averaged just 15,930, a 1,640 job and -9.3 percent downturn below the 17,570 jobs tallied in 2019. There was some job growth (up 20 jobs and 1.8 percent) in mining, logging, and construction (where the lion’s share of employment is in the local construction industry) and in information and financial activities (up 70 jobs and 11.7 percent). But state and local government education plummeted by 1,000 jobs (-19.6 percent) and leisure and hospitality (primarily hotels, eating and drinking places, and amusement and recreation services) lost 560 jobs (-19.9 percent) to account for about 95 percent of the 1,640 jobs lost countywide during the first year of the COVID-19 pandemic. Statewide, nonfarm employment shrank by -5.4 percent between 2019 and 2020.
- In 2021 – Kittitas County's nonfarm economy netted 160 fewer jobs (-1.0 percent) in 2021 than in 2020 as employment slipped from 15,930 to 15,770 jobs. Washington’s nonfarm job market rebounded with a 2.5 percent job growth rate. The main reason for this lackluster performance in the local economy was that state and local government education averaged 370 fewer jobs in 2021 (3,720 jobs) than in 2020 (4,090 jobs). In Kittitas County the big kid on the block, in terms of “state and local government education” employment, is Central Washington University (CWU). Faculty, staff (i.e., administrative, transportation, and maintenance/logistical staff), plus university student interns/employees, at this institution have felt the pinch since the onset of the COVID-19 pandemic. This belt tightening is not unique to CWU. Across Washington, state government education provided fewer jobs (year over year) in 2020 and in 2021, and as recently as May 2022. Specifically, state government education tallied 72,000 jobs in Washington state in May 2022 versus 86,200 jobs in May 2019 (the pre-COVID-era), down by 14,200 jobs and -16.4 percent.
Analysis using QCEW data:
The North American Industry Classification System (NAICS) is an industry classification system that groups businesses and organizations into categories or sectors based on the activities in which they are primarily engaged. There are 19 private sectors and three government sectors (for a total of 22 sectors) at the two-digit NAICS code level, within each county-level economy. One can observe much about the structure of a county’s economy by quantifying and comparing the number of jobs and the percentage of jobs in these sectors by using average annual QCEW data. The most recent average annual employment data available for Kittitas County are for 2021.
The top five Kittitas County sectors in 2021 in terms of employment were:
| Sector | Number of jobs | Share of employment |
| 1. Local government | 2,347 | 15.5% |
| 2. Accommodation and food services | 2,250 | 14.8% |
| 3. Retail trade | 1,893 | 12.5% |
| 4. State government | 1,772 | 11.7% |
| 5. Health Services | 1,223 | 8.1% |
| All other industries | 5,676 | 37.4% |
| Total covered employment | 15,161 | 100% |
Source: Employment Security Department/DATA Division, QCEW
Approximately 62.6 percent of all jobs in Kittitas County were in five, two-digit NAICS industries or sectors (local government, accommodation and food services, retail trade, state government and private health services). Hence, the Kittitas County economy is not very diversified – like many other agriculturally based economies here in Central Washington (Adams, Chelan, Douglas, Grant, Okanogan and Yakima counties, etc.).
Covered employment trends over the last 10 years (from 2011 through 2021) were analyzed using ESD’s average annual QCEW data for the 22 two-digit NAICS sectors in Kittitas County. Total covered employment countywide tallied 13,467 jobs in 2011 and 15,161 in 2021, a 12.6 percent upturn and an annualized growth rate of 1.2 percent. Washington state’s covered employment expanded at a slightly more rapid pace of 1.6 percent during this 10-year timeframe. Following are some findings that reference industry sectors gaining relatively large numbers of jobs during this period:
- In 2011, the construction sector (NAICS 23) accounted for 4.3 percent of total covered employment in Kittitas County, but this percentage soared to 8.0 percent in 2021. Quantitatively, employment escalated from 581 jobs in 2011 to 1,215 in 2021 – a robust 109.1 jump. Of all 22 NAICS sectors in Kittitas County, construction added the greatest number of jobs during this 10-year timeframe. This construction employment “boom” equated to an annualized growth rate of 7.7 percent across Kittitas County from 2011 to 2021 versus an annualized total covered employment growth pace of 1.2 percent.
- Of all 22 NAICS sectors, retail trade added the second-highest number of jobs across Kittitas County during this most recent 10-year period. Retail trade stores and business (NAICS 44-45) accounted for 11.2 percent of total covered employment in Kittitas County in 2011, but this percentage has steadily expanded to 12.5 percent in 2021. Quantitatively, employment rose from 1,508 jobs in 2011 to 1,893 in 2021, a respectable 22.9 percent advance – equating to an annualized growth rate of 2.3 percent.
- Agriculture (NAICS 11) provided 814 jobs in 2011 versus 1,090 in 2021, a 276 job and 33.9 percent upturn, placing this industry in third place in terms of the number of jobs added in Kittitas County during this 10-year timeframe. Of these 276 new agricultural jobs, over 90 percent were in the crop production (NAICS 11) subsector which registered 648 jobs in 2011 and 897 in 2021, a 249-job and 38.4 percent employment upturn, for an annualized growth rate of 3.3 percent – considerably faster than the 1.2 percent annualized total covered employment growth rate between 2011 and 2021.
For historical industry employment data, contact an economist.
Source: Employment Security Department/DATA Division, QCEW
Industry employment by age and gender
The Local Employment Dynamics (LED) database, a joint project of state employment departments and the U.S. Census Bureau, matches state employment data with federal administrative data. Among the products is industry employment by age and gender. All workers covered by state unemployment insurance data are included; federal workers and non-covered workers, such as the self-employed, are not. Data are presented by place of work, not place of residence.
Kittitas County highlights:
The two largest job holder age groups in Kittitas County were the 55+ and the 25 to 34-year-old categories. These two categories accounted for 24.7 percent and 20.6 percent of employment respectively in 2020.
In 2020, there were substantial differences in gender ratio by industry in Kittitas County:
- Male-dominated industries included transportation and warehousing (84.1 percent), construction (82.2 percent) and wholesale trade (71.2 percent).
- Female-dominated industries included finance and insurance (75.4 percent), health care and social assistance (75.3 percent), and professional, scientific and technical services (62.8 percent).
Source: The Local Employment Dynamics
In 2021, there were 15,161 covered employment jobs (which included the agricultural industry) in Kittitas County, based on preliminary figures. The total payroll for 2021 was approximately $737.9 million. The average annual wage was $48,670 or 60.2 percent of the state average of $82,513.
The top five Kittitas County industries in 2021 in terms of payrolls were:
| Sector | Payroll | Share of payrolls |
| 1. Local government | $142,602,829 | 19.3% |
| 2. State government | $130,413,335 | 17.7% |
| 3. Construction | $82,903,044 | 11.2% |
| 4. Retail trade | $62,209,812 | 8.4% |
| 5. Accommodation and food services | $57,525,390 | 7.8% |
| All other industries | $233,488,754 | 34.9% |
| Total covered payrolls | $737,885,909 | 100% |
Source: Employment Security Department/DATA Division, QCEW
As shown in the table above, QCEW data showed that nearly two-thirds (65.1 percent) of total covered wage income in 2021 was earned in five, two-digit NAICS industries or sectors (local government, state government, construction, retail trade and accommodation and food services). Three of the largest government organizations, from an employment perspective, in Kittitas County (according to the Ellensburg Downtown Association or EDA website) are: Central Washington University (CWU) a state government organization; and Kittitas Valley Hospital (KVH) and the Ellensburg School District, both local government organizations. It is safe to say that these three institutions were also major contributors to the 2021 state and local government payroll figures.
Covered wage trends over the last 10 years (from 2011 through 2021) were analyzed using the ESD’s average annual QCEW data for the 22 two-digit NAICS sectors in Kittitas County. Total covered wages countywide tallied approximately $439.5 million in 2011 and $737.9 million in 2021, a 67.9 percent upturn (not adjusted for inflation) and an annualized growth rate of 5.3 percent. Following are some findings referencing the two industry sectors which ranked number 1 and number 2 in terms of payroll growth (in dollars) in this recent 10-year period (2011-2021):
- The construction industry sector registered as the highest payroll growth (in dollars) in Kittitas County between 2011 and 2021. This category saw earned wage income rise by $58.3 million, from $24.6 million in 2011 to $82.9 million in 2021, a dramatic 237.3 percent increase. The annualized construction industry payroll growth rate from 2011 through 2021 was 12.9 percent. In 2011, 5.6 percent of total covered wages countywide were earned in the construction industry. In 2021, 11.2 percent of total covered wages in Kittitas County were earned in the local construction industry – an appreciable five and six-tenths percentage point increase during these ten years. As mentioned in the State of Washington 2020 Population Trends report published by Washington state’s Office of Financial Management (OFM), Kittitas County was ranked as the second-fastest growing county (by percentage change) amongst Washington state’s 39 counties during the 10-year period from 2010 to 2020. People are literally “coming with their own money” and buying land, building homes, and settling down in Kittitas County, hence the boom in the local construction industry.
- Between 2011 and 2021, the sector which ranked number 2 of all 22 NAICS sectors in Kittitas County in terms of payroll growth was local government. This category includes Kittitas Valley Hospital (KVH), local public schools, police and fire departments, courts, libraries, city and county government administrative offices, etc. In 2011, QCEW data indicated that local government workers earned $85.1 million. Ten years later in 2021, local government organizations across Kittitas County paid out $142.6 million in wages, a substantial payroll jump $57.5 million and a 67.6 percent increase.
Average annual wages in 2021 were highest in finance and insurance ($80,846), information ($68,985) and construction ($68,233). Average annual wages were lowest in arts, entertainment and recreation ($25,502), accommodation and food services ($25,567) and in retail trade ($32,863).
Personal income
Personal income includes earned income, investment income, and government payments such as Social Security and Veterans Benefits. Investment income includes income imputed from pension funds and from owning a home. Per capita personal income equals total personal income divided by the resident population.
Inflation adjusted per capita income in Kittitas County was estimated at $45,267 in 2020, 67.4 percent of the state average ($67,126) and 76.1 percent of the U.S. average ($59,510).
Earnings as a percent of total personal income in 1970 made up 73 percent of total income of the typical Kittitas County resident, but this percentage has generally been decreasing. By 2020 (fifty years later) earned income was only 55 percent of total personal income – a substantial 18 percentage-point drop during this 50-year period. Conversely, government transfer payments as a proportion of county residents’ personal income have increased from 11 percent in 1970 to 25 percent in 2020 – up 14 percentage points during this timeframe.
According to the U.S. Census Bureau QuickFacts, the median household income in Kittitas County was $59,703 (in 2020 dollars) from 2016 to 2020. This was 77.5 percent of the statewide median household income ($70,116) and 91.9 percent of the national median household income of $64,994 during this timeframe.
Kittitas County’s poverty rate of 12.9 percent in the period 2016 to 2020 was higher than the state’s rate of 9.5 percent, and the nation’s rate of 11.4 percent, according to U.S Census Bureau QuickFacts. Relatively low student wages often increase poverty statistics in college-dominant counties such as Kittitas (where a major employer is Central Washington University or CWU).
Source: Employment Security Department/DATA Division, County Data Tables, Bureau of Economic Analysis, U.S. Census Bureau
Kittitas County’s population in 2021 was 45,499. The population grew 2.6 percent from April 1, 2020 through July 1, 2021, faster than the state’s 0.4 percent growth rate during this timeframe. Anecdotal evidence suggests that some of this in-migration is caused by people retiring and moving to Kittitas County. It is also conceivable that some of this rapid population growth in Kittitas County is due to COVID-19 effects on, and attitudes towards, teleworking. The pandemic has enabled some employees who formerly lived and worked in large metropolitan areas, such as the Seattle-Bellevue-Everett Primarily Metropolitan Statistical Area (PMSA), to telework from and reside in less-densely populated areas (such as Kittitas County).
Source: U.S. Census Bureau QuickFacts
Population facts
| Kittitas County | Washington state | |
| Population 2021 | 45,499 | 7,739,692 |
| Population 2020 | 44,337 | 7,705,281 |
| Percent change, 2020 to 2021 | 2.6% | 0.4% |
Source: U.S. Census Bureau QuickFacts
But rapid population growth in Kittitas County is not a new phenomenon. In fact, Washington state’s OFM stated in Table 3 of their State of Washington 2020 Population Trends report, that Kittitas County’s population jumped by 17.7 percent from 2010 to 2020. The population growth rate ranked Kittitas County as the second-fastest growing county (by percentage change) amongst Washington state’s 39 counties during this 10-year period. According to this report, Franklin County was the fastest growing county in Washington during this timeframe.
Age, gender and ethnicity
In 2021, a slightly larger portion (17.0 percent) of Kittitas County’s population was 65 years and older compared to the state (16.2 percent). However, the county had a lower proportion of its residents under the age of 18 (16.8 percent) in 2021 than across the state (21.7 percent).
In 2021, 91.3 percent of Kittitas County’s residents were white, higher than the state (77.5 percent); while 2.1 percent of the county’s residents were Asian, considerably less than across Washington state (10.0 percent).
Source: U.S. Census Bureau QuickFacts
Demographics
| Kittitas County | Washington state | |
| Population by age, 2021 | ||
| Under 5 years old | 4.3% | 5.6% |
| Under 18 years old | 16.8% | 21.7% |
| 65 years and older | 17.0% | 16.2% |
| Females, 2021 | 49.5% | 49.6% |
| Race/ethnicity, 2021 | ||
| White | 91.3% | 77.5% |
| Black | 1.2% | 4.5% |
| American Indian, Alaskan Native | 1.4% | 2.0% |
| Asian, Native Hawaiian, other Pacific Islander | 2.1% | 10.0% |
| Hispanic or Latino, any race | 9.6% | 13.7% |
Source: U.S. Census Bureau QuickFacts
Educational attainment
Approximately 91.8 percent of Kittitas County residents age 25 and older were high school graduates, almost identical to Washington state (91.7 percent) and a little higher than the nation (88.5 percent) over the period of 2016 to 2020.
From 2016 to 2020, those with a bachelor’s degree or higher comprised 34.1 percent of Kittitas County residents age 25 and older, slightly less than the 36.7 percent of state residents. Across the U.S. approximately 32.9 percent of residents have earned a bachelor’s degree.
Source: U.S. Census Bureau QuickFacts
- Economic Development Group/Kittitas County Chamber of Commerce
- County data tables
- Census Bureau County Profile
- 2020 Census State Profile
- Population density history
- Ellensburg Business Development Authority
- Kittitas County - About the County
- Kittitas County home page
- Kittitas County on ChooseWashington.com
- Kittitas County History
- Kittitas County on ofm.wa.gov
- South Central Workforce Council
- Self sufficiency calculator for Washington state
- Census Bureau QuickFacts
- Washington Ports
- Workforce Development Areas and WorkSource Office Directory