English | Español
QUICK LINKS
FREQUENTLY USED LINKS
RELATED LINKS
FORMS
CONTACT US
January 2024 Monthly Employment Report
3/6/2024
FOR IMMEDIATE RELEASE – March 6, 2024
Contact: media@esd.wa.gov
Payroll employment decreased in January; unemployment rate rose to 4.6%
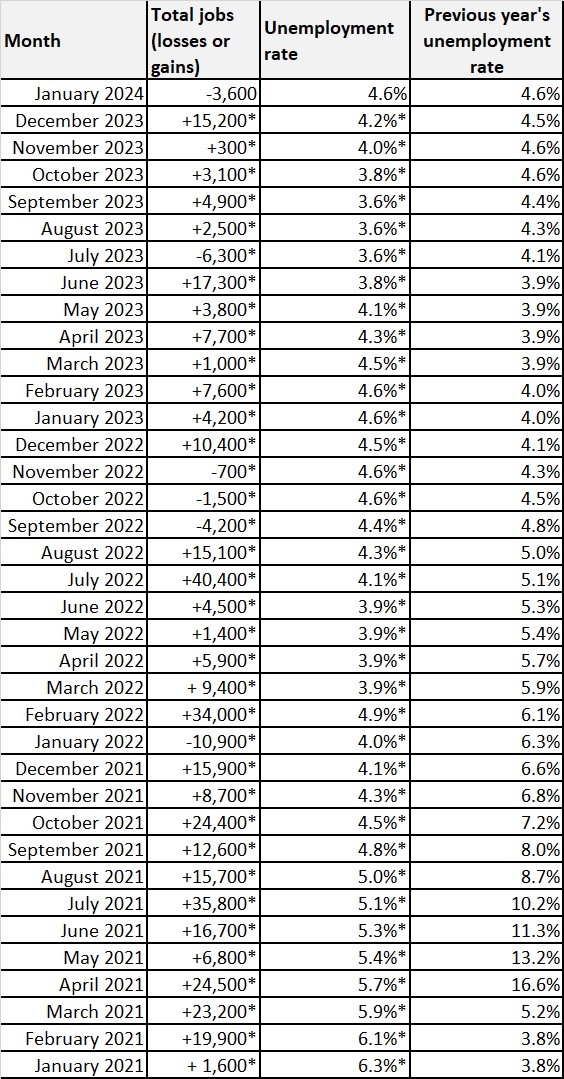
OLYMPIA – Washington’s economy lost an estimated 3,600 jobs (seasonally adjusted) and the monthly unemployment rate rose from 4.2% in December to 4.6% in January. The state’s labor force remained relatively unchanged year over year as several major industry sectors added or shed jobs. The first month of 2024 also showed that job growth is slowing, reinforced by an increase in the unemployment rate.
ESD paid unemployment benefits to 77,692 people in January, an increase of 9,522 paid claims compared to December. Seasonal increases in paid claims within agriculture, construction, manufacturing, and leisure and hospitality contributed to the overall increase in claims over the month.
Visit ESD’s website to view the entire Monthly Employment Report for January 2024.
Updated state preliminary data for December 2023
- The preliminary estimated gain of 7,700 jobs was revised to 15,200 jobs.
- The seasonally adjusted monthly unemployment rate was confirmed at 4.2%.
“December’s job growth was bolstered by strong upward revisions,” said Employment Security Department (ESD) Chief Labor Economist Anneliese Vance-Sherman. “Two trends characterized 2023: The first was slowing payroll growth compared to previous post-COVID years. The second was a tight labor market with low unemployment rates.”
National unemployment rate
The national unemployment rate remained constant at 3.7% in January. For comparison, the national unemployment rate (revised) for January 2023 was 3.4%.
Labor force showed little change year over year
From December 2023 to January 2024, the number of people who were unemployed statewide increased from 170,380 to 183,847. In the Seattle/Bellevue/Everett region, the number of people who were unemployed increased from 66,198 to 68,674 over the same period.
The state’s labor force in January numbered 4,032,808 – a decrease of 26,819 people from the previous month. In the Seattle/Bellevue/Everett region, the labor force decreased by 9,270 people during the same period.
Labor force is defined as the total number of people, both employed and unemployed, over the age of 16. Layoffs and labor force participation are not necessarily connected. When people are laid off but still seeking work, they remain a part of the labor force. A drop in the labor force means people have left work and haven't been actively seeking employment for more than four weeks.
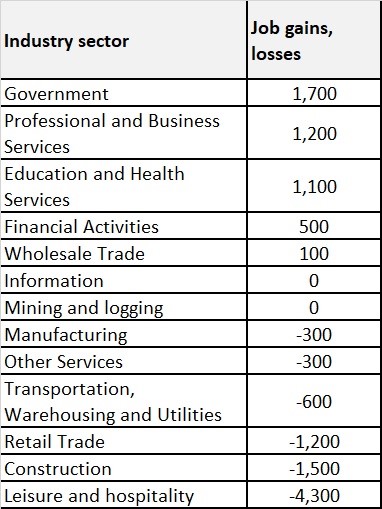
Five major industry sectors add jobs, six shed jobs and two were unchanged in January
Private sector employment decreased by 5,300 jobs from December to January while government employment increased by 1,700 jobs.
Of the industry sectors, in January:
- Five expanded.
- Six contracted.
- Two remained constant.
The largest sector level gains in private industry were in professional and business services
(up 1,200), and education and health services (up 1,100). The deepest losses came from leisure and hospitality (down 4,300).
Here are some key increases and decreases within these three sectors:
- The largest gains in the professional and business services sector were attributable to hiring in computer systems design and related services (up 800), and architectural and engineering services (up 700).
- Hiring in education and health services was concentrated in ambulatory health care services, such as doctors’ offices (up 2,000).
- Losses from the leisure and hospitality sector were observed throughout the sector, but the deepest losses came from arts, entertainment and recreation (down 2,500).
Annual employment growth most evident in government and education, and health services
Washington gained an estimated 50,100 jobs from January 2023 to January 2024, not seasonally adjusted. Private sector employment rose by 1.0%, up an estimated 29,000 jobs, while public sector employment rose by 3.7% — up an estimated 21,100 jobs.
From January 2023 to January 2024, nine major industry sectors expanded and four decreased
The three industry sectors with the largest employment gains year over year, not seasonally adjusted, were:
- Education and health services, up 24,000 jobs.
- Government, up 21,100 jobs.
- Leisure and hospitality, up 16,600 jobs.
The two industry sectors with the largest employment losses year over year, not seasonally adjusted, were:
- Construction, down 9,300 jobs.
- Information, down 7,800 jobs.
Table 1: Washington’s total jobs
*Revised from previous preliminary estimates. Preliminary monthly estimates for job losses or gains are based
on a small Bureau of Labor Statistics payroll survey. Actual figures reported the following month are based on
a more complete survey.
Table 2: January job gains and losses by industry
Labor market information
See more labor market information and tools, including interactive Tableau graphics, to highlight popular information and data.
WorkSource
Employment Security is a proud partner in the statewide WorkSource system, which provides employment and training assistance to job seekers and businesses. WorkSourceWA provides access to thousands of Washington jobs and other employment resources. WorkSource staff can connect job seekers with employers hiring right now in their community, identify training opportunities or help them brush up on application and interview skills. Job seekers and employers can find their nearest WorkSource center on the WorkSource office locator page.
Learn more about ESD’s monthly employment reports
Every month, the Employment Security Department publishes preliminary seasonally adjusted estimates for the prior month’s job growth and unemployment. We also publish confirmed data for the month before last. See the entire Monthly Employment Report on our website.
Monthly Employment Report publication schedule for 2024
|
Preliminary data for the month |
State and Metropolitan Division data release |
All other county data released |
|
January |
March 6, 2024 | March 12, 2024 |
|
February |
March 20, 2024 |
March 26, 2024 |
|
March |
April 17, 2024 |
April 23, 2024 |
|
April |
May 22, 2024 |
May 28, 2024 |
|
May |
June 19, 2024 |
June 25, 2024 |
|
June |
July 17, 2024 |
July 23, 2024 |
|
July |
Aug. 14, 2024 |
Aug. 20, 2024 |
|
August |
Sept. 18, 2024 |
Sept. 24, 2024 |
|
September |
Oct. 16, 2024 |
Oct. 22, 2024 |
|
October |
Nov. 13, 2024 |
Nov. 19, 2024 |
|
November |
Dec. 18, 2024 |
Dec. 24, 2024 |
|
December |
Jan. 22, 2025 |
Jan. 28, 2025 |
U-6 unemployment rate
The U.S. Bureau of Labor Statistics (BLS) updated its “alternative measures of labor underutilization” for states to include annual averages for 2021. One such alternative measure is the U-6 rate, which considers not only the unemployed population in the official “U-3” unemployment rate, but also marginally attached workers and those employed part time for economic reasons. The U-6 rate is defined by BLS as the “total unemployed, plus all marginally attached workers, plus total employed part time for economic reasons, as a percent of the civilian labor force plus all marginally attached workers.” This U-6 measure measures the “unemployed, underemployed, and those who are not looking but who want a job.”
The U-6 annual average unemployment rate for the four-quarter period through fourth quarter 2023 for Washington state was 8.1%. This is above the 7.5% average for the four-quarter period through third quarter 2023. The U.S. U-6 average for the four-quarter period through fourth quarter 2023 was 6.9%.
Web links
- Monthly employment report
- Labor market information website
- Historical data
- Employment Security website