English | Español
QUICK LINKS
FREQUENTLY USED LINKS
RELATED LINKS
FORMS
CONTACT US
August 2023 Monthly Employment Report press release
10/16/2023
FOR IMMEDIATE RELEASE – Sept. 13, 2023
Contact: media@esd.wa.gov
Payroll employment increases in August, unemployment rate remains constant
OLYMPIA – Washington’s economy gained an estimated 2,900 jobs (seasonally adjusted) and the monthly unemployment rate remained at 3.6% in August.
"Job growth resumed in August after declining in July,” said Employment Security Department (ESD) State Economist Paul Turek. "The modest increase continues the pattern of job growth moving at a far cooler pace than the substantial job gains of the past two years.”
Visit ESD’s website to view the entire Monthly Employment Report for August.
ESD paid unemployment benefits to 56,935 people in August, an increase of 1,763 paid claims over the previous month. Increases in paid claims within agriculture, and the health and social assistance sectors contributed to the overall increase in claims over the month.
National unemployment rate
The national unemployment rate increased in August from 3.5% to 3.8% For comparison, the national unemployment rate (revised) for August 2022 was 3.7%.
Updated state preliminary data for July 2023
- The preliminary estimated loss of 6,400 jobs in July was revised to a loss of 6,300 jobs.
- The seasonally adjusted monthly unemployment rate in July was confirmed at 3.6%.
Labor force slightly contracts
The state’s labor force in August numbered 4,067,300 – a decrease of 2,000 people from the previous month.
In the Seattle/Bellevue/Everett region, the labor force increased by 4,400 over the same period.
Labor force is defined as the total number of people, both employed and unemployed, over the age of 16. Layoffs and labor force participation are not necessarily connected. When people are laid off but still seeking work, they remain a part of the labor force. A drop in the labor force means people have left work and haven't been actively seeking employment for more than four weeks.
From August 2022 to August 2023, the state’s labor force increased by 66,300, while the labor force in the Seattle/Bellevue/Everett region increased by 44,700 over the same period.
From July to August 2023, the number of people who were unemployed statewide decreased from 147,400 to 146,100. In the Seattle/Bellevue/Everett region, the number of people who were unemployed increased from 55,900 to 57,900 over the same period.
Monthly job growth mixed across industries
Private sector employment increased by 2,700 jobs from June to July while government employment increased by 200 jobs.
Of the industry sectors, in August:
- Seven expanded.
- Six contracted.
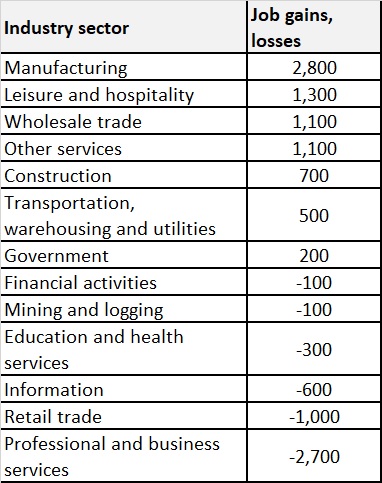
Here are some key increases and decreases:
- Manufacturing employment rose by 2,800, led by 500 jobs gained in transportation equipment manufacturing.
- The number of jobs in leisure and hospitality increased by 1,300, with 600 jobs gained in arts, entertainment, and recreation.
- Employment in other services increased by 1,100 overall, with 700 jobs added in personal and laundry services.
- Retail trade employment decreased by 1,000 overall, with 1,600 jobs lost in other trade.
Professional and business services employment decreased by 2,700, with 2,400 jobs lost in employment services.
Annual employment growth most evident in education and health services
Washington gained an estimated 55,200 jobs from August 2022 to August 2023, not seasonally adjusted. Private sector employment rose by 1.5%, up an estimated 46,600 jobs, while public sector employment rose by 1.6%, up an estimated 8,600 jobs.
From August 2022 – August 2023, nine major industry sectors expanded and four decreased
The three industry sectors with the largest employment gains year over year, not seasonally adjusted, were:
- Education and health services, up 22,400 jobs.
- Leisure and hospitality, up 18,700 jobs.
- Government, up 8,600 jobs.
The three industry sectors with the largest employment losses year over year, not seasonally adjusted, were:
- Information, down 8,900 jobs.
- Professional and business services, down 6,400 jobs
- Retail trade, down 3,200 jobs.
Table 1: Washington’s total jobs
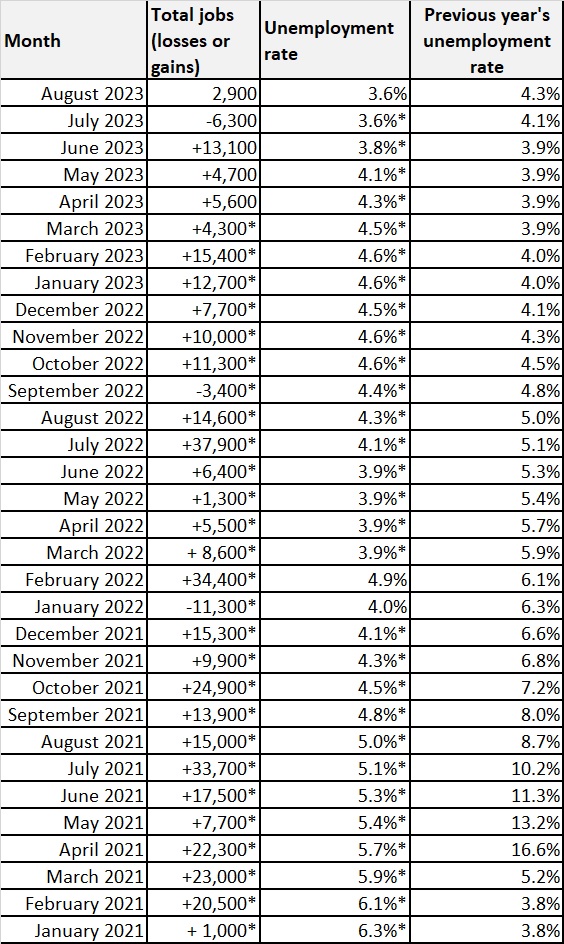
*Revised from previous preliminary estimates. Preliminary monthly estimates for job losses or gains are
based on a small Bureau of Labor Statistics payroll survey. Actual figures reported the following month
are based on a more complete survey.
Table 2: Job gains and losses by industry for August
Labor market information
See more labor market information and tools, including interactive Tableau graphics, to highlight popular information and data.
WorkSource
Employment Security is a proud partner in the statewide WorkSource system, which provides employment and training assistance to job seekers and businesses. WorkSourceWA provides access to thousands of Washington jobs and other employment resources. WorkSource staff can connect job seekers with employers hiring right now in their community, identify training opportunities or help them brush up on application and interview skills. Job seekers and employers can find their nearest WorkSource center on the WorkSource office locator page.
Learn more about ESD’s monthly employment reports
Every month, the Employment Security Department publishes preliminary seasonally adjusted estimates for the prior month’s job growth and unemployment. We also publish confirmed data for the month before last. See the entire Monthly Employment Report on our website.
Monthly Employment Report publication schedule for 2023
|
Preliminary data for the month |
State and Metropolitan Division data release |
All other county data released |
|
August |
Sept. 13, 2023 |
Sept. 19, 2023 |
|
September |
Oct. 18, 2023 |
Oct. 24, 2023 |
|
October |
Nov. 15, 2023 |
Nov. 21, 2023 |
|
November |
Dec. 20, 2023 |
Dec. 26, 2023 |
|
December |
Jan. 17, 2024 |
Jan. 23, 2024 |
U-6 unemployment rate
The U.S. Bureau of Labor Statistics (BLS) updated its “alternative measures of labor underutilization” for states to include annual averages for 2021. One such alternative measure is the U-6 rate, which considers not only the unemployed population in the official “U-3” unemployment rate, but also marginally attached workers and those employed part time for economic reasons. The U-6 rate is defined by BLS as the “total unemployed, plus all marginally attached workers, plus total employed part time for economic reasons, as a percent of the civilian labor force plus all marginally attached workers.” This U-6 measure measures the “unemployed, underemployed, and those who are not looking but who want a job.”
The U-6 annual average unemployment rate for the four-quarter period through second quarter 2023 for Washington state was 7.3 percent. This was lower compared to the 7.4 percent average for the four-quarter period through first quarter 2023. The U.S. U-6 average for the four-quarter period through second quarter 2023 was 6.7 percent.
Web links
- Monthly employment report
- Labor market information website
- Historical data
- Employment Security website