English | Español
QUICK LINKS
FREQUENTLY USED LINKS
RELATED LINKS
FORMS
CONTACT US
April 2023 Monthly Employment Report
5/17/2023
FOR IMMEDIATE RELEASE – May 17, 2023
Contact: media@esd.wa.gov
Job growth strengthens in April
OLYMPIA – Washington’s economy gained an estimated 6,100 jobs (seasonally adjusted) in April.
"Nonfarm payroll employment growth in Washington for March and April shows a labor market that is very resilient,” said Employment Security Department (ESD) State Economist Paul Turek. "The weaker preliminary hiring numbers in March were revised upward and April’s job numbers are more solid. Although job growth has moderated, it is still proceeding at a healthy pace.”
Visit ESD’s website to view the entire Monthly Employment Report for April.
Washington’s monthly unemployment rate decreased slightly to 4.3% in April
ESD paid unemployment insurance benefits to 57,615 people in April, a decrease of 6,440 paid claims over the previous month. Decreases in paid claims within the construction and agriculture sectors contributed to the overall decrease in paid claims over the month.
National unemployment rate
The national unemployment rate decreased slightly in April from 3.5% to 3.4%. For comparison, the national unemployment rate (revised) for April 2022 was 3.6%.
Updated state preliminary data for March 2023
- The preliminary estimated gain of 1,500 jobs for March 2023 was revised upwards to a gain of 4,300 jobs.
- The seasonally adjusted monthly unemployment rate was confirmed at 4.5%.
Labor force grows for fourth consecutive month
The state’s labor force in April numbered 4,057,300 – an increase of 10,000 people from the previous month.
In the Seattle/Bellevue/Everett region, the labor force increased by 4,900 over the same period.
Labor force is defined as the total number of people, both employed and unemployed, over the age of 16. Layoffs and labor force participation are not necessarily connected. When people are laid off but still seeking work, they remain a part of the labor force. A drop in the labor force means people have left work and haven't been actively seeking employment for more than four weeks.
From April 2022 to April 2023, the state’s labor force increased by 34,000, while the Seattle/Bellevue/Everett region increased by 27,700.
From March to April, the number of people who were unemployed statewide decreased from 180,400 to 174,700. In the Seattle/Bellevue/Everett region, the number of people who were unemployed decreased from 53,200 to 53,100 over the same period.
Private sector employment increased by 7,200 jobs while government employment decreased by 1,100 jobs.
Of the industry sectors, in April:
- Seven expanded.
- Five contracted.
- One remained constant.
Here are some key increases and decreases:
- Construction sector employment rose by 4,300, with 3,700 jobs added by specialty trade contractors.
- The number of jobs in the education and health services sector increased by 2,500 overall, with 800 jobs gained in ambulatory health care services.
- Leisure and hospitality sector employment increased by 1,300 overall, with 2,200 jobs gained in the food services and drinking places sub-sector.
- Retail trade sector employment increased by 700 overall, with 1,100 jobs added by general merchandise stores.
- Professional and business services sector employment decreased by 800 overall, with 1,000 jobs lost in employment services.
Annual employment growth
Washington gained an estimated 116,700 jobs from April 2022 to April 2023, not seasonally adjusted. Private sector employment rose by 3.4%, up an estimated 98,300 jobs, while public sector employment rose by 3.2% — up an estimated 18,400 jobs.
From April 2022 – April 2023, all 13 major industry sectors expanded
The three industry sectors with the largest employment gains year over year, not seasonally adjusted, were:
- Education and health services, up 26,200 jobs.
- Leisure and hospitality, up 21,300 jobs.
- Government, up 18,400 jobs.
Additional observations
- Labor force participation increased in April for the fourth straight month, leading to a greater supply of workers.
- On the demand side, job openings in Washington appear to have peaked. The number of openings in February declined by 22% and are expected to have declined again in March. Despite the directional slowdown, the job market remains tight.
- Temporary help employment (temporary staffing agencies), which can be a useful indicator of labor demand growth, fell once again in April. It was down 1,000 over the month and is now down 6,100 over the year through April.
Table 1: Washington’s total jobs
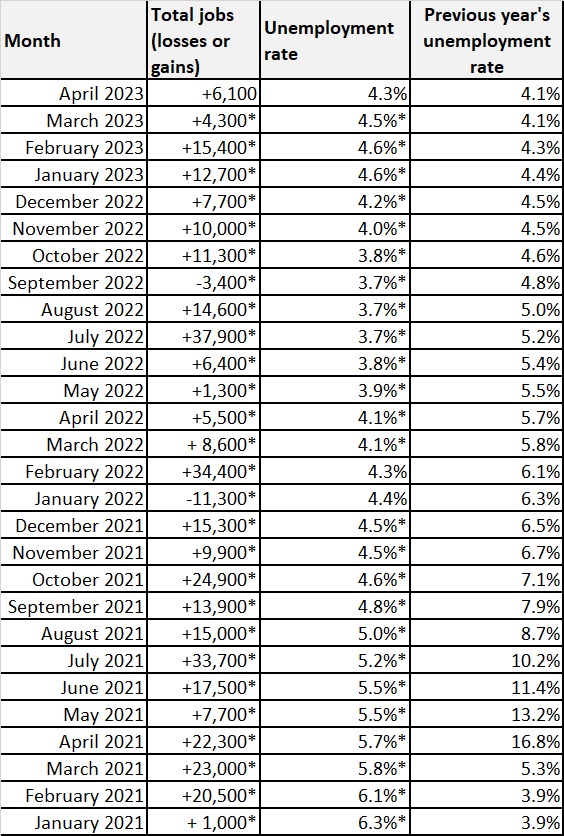
*Revised from previous preliminary estimates. Preliminary monthly estimates for job losses or gains are
based on a small Bureau of Labor Statistics payroll survey. Actual figures reported the following month are
based on a more complete survey.
Table 2: Job gains and losses by industry
.jpg)
Labor market information
See more labor market information and tools, including interactive Tableau graphics, to highlight popular information and data.
WorkSource
Employment Security is a proud partner in the statewide WorkSource system, which provides employment and training assistance to job seekers and businesses. WorkSourceWA provides access to thousands of Washington jobs and other employment resources. WorkSource staff can connect job seekers with employers hiring right now in their community, identify training opportunities or help them brush up on application and interview skills. Job seekers and employers can find their nearest WorkSource center on the WorkSource office locator page.
Learn more about ESD’s monthly employment reports
Every month, the Employment Security Department publishes preliminary seasonally adjusted estimates for the prior month’s job growth and unemployment. We also publish confirmed data for the month before last. See the entire Monthly Employment Report on our website.
Monthly Employment Report publication schedule for 2023
|
Preliminary data for the month |
State and Metropolitan Division data release |
All other county data released |
|
April |
May 17, 2023 |
May 23, 2023 |
|
May |
June 14, 2023 |
June 20, 2023 |
|
June |
July 19, 2023 |
July 25, 2023 |
|
July |
August 16, 2023 |
August 22, 2023 |
|
August |
September 13, 2023 |
September 19, 2023 |
|
September |
October 18, 2023 |
October 24, 2023 |
|
October |
November 15, 2023 |
November 21, 2023 |
|
November |
December 20, 2023 |
December 26, 2023 |
|
December |
January 17, 2024 |
January 23, 2024 |
U-6 unemployment rate
The U.S. Bureau of Labor Statistics (BLS) updated its “alternative measures of labor underutilization” for states to include annual averages for 2021. One such alternative measure is the U-6 rate, which considers not only the unemployed population in the official “U-3” unemployment rate, but also marginally attached workers and those employed part time for economic reasons. The U-6 rate is defined by BLS as the “total unemployed, plus all marginally attached workers, plus total employed part time for economic reasons, as a percent of the civilian labor force plus all marginally attached workers.” This U-6 measure measures the “unemployed, underemployed, and those who are not looking but who want a job.”
The U-6 annual average unemployment rate for the four-quarter period through first quarter 2023 for Washington state was 7.4%. This was lower compared to the 10.1% average annual U-6 unemployment rate for 2021. The U.S. U-6 average annual unemployment rate for 2022 was 6.9%.
Web links
- Monthly employment report
- Labor market information website
- Historical data
- Employment Security website