

Posted October 2025
August 2025 highlights
In August, the not seasonally adjusted monthly unemployment rate decreased from 5.1% to 4.5%. Total nonfarm employment decreased by 3,560 jobs in Whitman County from August 2024.
Summary
Whitman County, found in Eastern Washington, is a part of the Palouse region — an area of prairie land primarily used for agriculture. As of 2024, the county had approximately 48,399 residents, with the largest age demographic share in the 20 to 24 years old group. Pullman, where Washington State University is located, is the largest city in Whitman County. Colfax is the county seat.
Whitman County is most influenced by the agriculture industry, specializing in wheat, barley, dry peas and lentils. It is the largest wheat producing county in the United States. Its largest employer is Washington State University, accounting for 30% of county employment. Schweitzer Engineering Laboratories, headquartered in Pullman, is a significant manufacturing presence developing critical infrastructure and energy transmission systems.
In 2024, the average annual labor force supply for the area was around 22,151 workers, with an average unemployment rate of 4.1%. There were approximately 1,163 businesses in the county during 2024.
Whitman County geographic overview
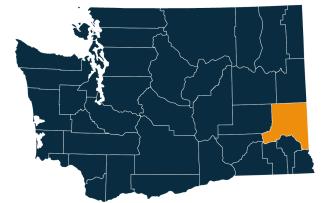
Whitman County is located in the southeastern part of Washington. It is not part of a larger metropolitan area but is known for its rich agricultural contributions. The city of Colfax serves as the county seat, while Pullman is the largest city in Whitman County, housing Washington State University.
The county spans 2,178 square miles, including 16 square miles of water. Its landscape features rolling hills, fertile farmland and the scenic Palouse region.
Whitman County was created out of Stevens County in 1871 and is named after Marcus Whitman, an early missionary in the region.
Washington has 12 regional Workforce Development Areas. Whitman County is part of Area 10, the Eastern Washington Partnership. Visit the Workforce Training & Education Coordinating Board website for information about the workforce regions.
Whitman County employment situation for August 2025
Monthly labor force and unemployment
- The not seasonally adjusted unemployment rate was 4.5% during August 2025, up from 4.3% in August 2024.
- The labor force decreased by 3,378 workers from August 2024 to August 2025.
- The total employment decreased by 3,283 workers from August 2024 to August 2025.
Unemployment rate, not seasonally adjusted
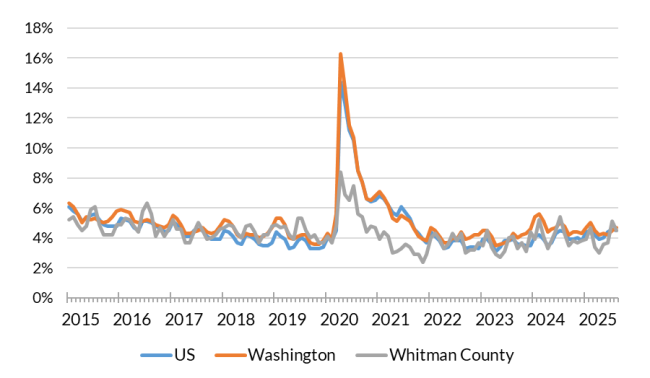
Source: Employment Security Department/Labor Market Information and Research Division, Local area unemployment statistics
Monthly payroll employment in Whitman County
-
As of August 2025, total nonfarm employment in Whitman County was 19,930 jobs, an increase of 260 jobs from the previous month but a decrease of 3,560 jobs from August 2024.
- Private sectors, totaling 10,800 jobs, increased by 150 jobs from the previous month and increased by 180 jobs from August 2024.
- Goods producing sectors, with 3,400 jobs, decreased by 10 jobs from the previous month but increased by 30 jobs from August 2024.
- Mining, logging and construction, with 430 jobs, decreased by 10 jobs from the previous month and decreased by 30 jobs from August 2024.
- Manufacturing, with 2,970 jobs, remained unchanged from the previous month but increased by 60 jobs from August 2024.
- Service providing sectors, with 16,520 jobs, increased by 270 jobs from the previous month but decreased by 3,590 jobs from August 2024.
- Wholesale trade, with 500 jobs, remained unchanged over the month but decreased by 40 jobs from August 2024.
- Retail trade, with 1,300 jobs, increased by 60 jobs over the month and by 30 jobs from August 2024.
- Professional and business services, with 780 jobs, remained unchanged over the month but decreased by 20 jobs from August 2024.
- Private education and health services, with 1,800 jobs, increased by 20 jobs over the month and by 130 jobs from August 2024.
- Leisure and hospitality, with 1,600 jobs, increased by 70 jobs over the month and by 10 jobs from August 2024.
- Government services including public educational services, with 9,130 jobs, increased by 110 jobs from the previous month but decreased by 3,730 jobs from August 2024.
- State government, with 6,550 jobs in August 2025, increased by 90 jobs over the month but decreased by 3,720 jobs over the year.
Nonfarm employment estimates, not seasonally adjusted, Whitman County
| NAICS Industry Title | Aug 2025 (Prelim) | Jul 2025 (Revised) | Aug 2024 (Revised) | Jul 2025 to Aug 2025 Change | Aug 2024 to Aug 2025 Change | Aug 2024 to Aug 2025 % Change |
|---|---|---|---|---|---|---|
| Total nonfarm | 19,930 | 19,670 | 23,490 | 260 | -3,560 | -15.2% |
| Total private (total nonfarm less government) | 10,800 | 10,650 | 10,620 | 150 | 180 | 1.7% |
| Goods-producing | 3,400 | 3,410 | 3,370 | -10 | 30 | 0.9% |
| - Mining, logging and construction | 430 | 440 | 460 | -10 | -30 | -6.5% |
| - Manufacturing | 2,970 | 2,970 | 2,910 | 0 | 60 | 2.1% |
| Service-providing | 16,520 | 16,250 | 20,110 | 270 | -3,590 | -17.9% |
| - Wholesale trade | 500 | 500 | 540 | 0 | -40 | -7.4% |
| - Retail trade | 1,300 | 1,240 | 1,270 | 60 | 30 | 2.4% |
| - Transportation, warehousing, and utilities | 410 | 410 | 410 | 0 | 0 | 0.0% |
| - Information | 100 | 100 | 100 | 0 | 0 | 0.0% |
| - Financial activities | 510 | 510 | 480 | 0 | 30 | 6.3% |
| - Professional and business services | 780 | 780 | 800 | 0 | -20 | -2.5% |
| - Private education and health services | 1,800 | 1,780 | 1,670 | 20 | 130 | 7.8% |
| - Leisure and hospitality | 1,600 | 1,530 | 1,590 | 70 | 10 | 0.6% |
| - Other services | 390 | 390 | 380 | 0 | 10 | 2.6% |
| - Government | 9,130 | 9,020 | 12,860 | 110 | -3,730 | -29.0% |
Note: Data benchmarked through March 2025, updated September 15, 2025.
Source: Employment Security Department/Labor Market Information and Research Division, Washington employment estimates (WA-QB & CES)
Detailed tables can be found on the source page in the third spreadsheet titled Current employment estimates, not seasonally adjusted.
Total covered employment
Employment by industry, Whitman County 2024 annual average
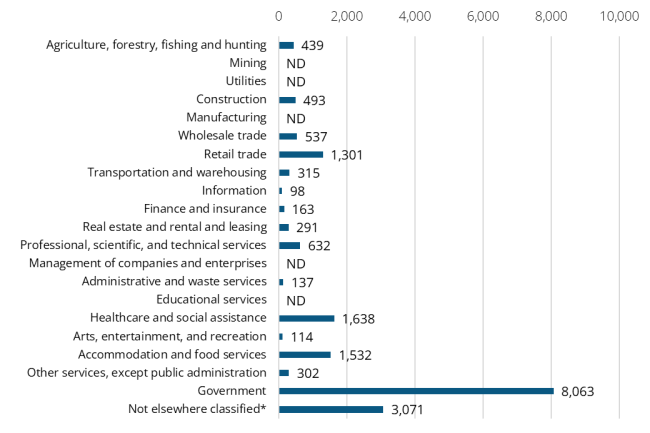
Source: Employment Security Department/Labor Market Information and Research Division, Covered Employment (QCEW)
During 2024, Whitman County’s average annual covered employment was 19,127. Covered employment refers to workers who received wages in Washington state and are eligible for state and federal unemployment insurance (UI) compensation programs.
Given the presence of workers associated with Washington State University, employment in the county is about half private and half government jobs. Some sectors do not have employment data displayed to avoid disclosure of identifiable data for individual employers, and those sectors are aggregated as not elsewhere classified.
Wages can vary substantially from one industry sector to another. The average annual wage in Washington state for all industries was $92,467 in 2024. The average annual wage in Whitman County was $64,503 in 2024.
Top sectors by employment in 2024:
- Government (8,063)
- Health care and social assistance (1,638)
- Accommodation and food services (1,532)
- Retail trade (1,301)
- Professional, scientific and technical services (632)
Top sectors by average annual wage in 2024:
- Professional, scientific and technical services ($92,182)
- Information ($87,727)
- Finance and insurance ($85,089)
- Wholesale Trade ($73,413)
- Government ($71,968)
Workforce demographics in Whitman County
The labor force participation rate is highest among the 25-29 age group at 83.2%, while the 65 to 74 age group has the lowest at 26.2%.
The male labor force has a slightly higher participation rate (76.1%) compared to the female labor force (71.2%). Those with a bachelor’s degree or higher have the highest participation rate at 83.8%, while those with less than a high school diploma have the lowest at 50.6%.
Visit the U.S. Census Bureau website for more quick facts about Whitman County.
Age
| Demographic characteristic | Total | Labor force participation rate | Unemployment rate |
|---|---|---|---|
| Population 16 years and over | 40,563 | 62.5% | 6.5% |
| 16 to 19 years | 5,358 | 42.8% | 26.6% |
| 20 to 24 years | 10,848 | 65.4% | 9.6% |
| 25 to 29 years | 3,504 | 83.2% | 1.3% |
| 30 to 34 years | 3,072 | 78.7% | 0.5% |
| 35 to 44 years | 4,717 | 80.6% | 2.9% |
| 45 to 54 years | 3,585 | 81.6% | 2.4% |
| 55 to 59 years | 1,864 | 72.6% | 3.4% |
| 60 to 64 years | 2,159 | 66.5% | 0.7% |
| 65 to 74 years | 3,124 | 26.2% | 6.7% |
| 75 years and over | 2,332 | 12.1% | 4.6% |
Race or Hispanic origin
| Demographic characteristic | Total | Labor force participation rate | Unemployment rate |
|---|---|---|---|
| White alone | 31,598 | 63.1% | 6.6% |
| Black or African American alone | 728 | 41.1% | 0.3% |
| American Indian and Alaska Native alone | 333 | 63.7% | 15.1% |
| Asian alone | 3,083 | 56.8% | 9.1% |
| Native Hawaiian and other Pacific Islander alone | 73 | 50.7% | 8.1% |
| Some other race alone | 1,039 | 72.5% | 1.7% |
| Two or more races | 3,709 | 63.3% | 4.7% |
| Hispanic or Latino origin (of any race) | 3,134 | 71.8% | 4.1% |
| White alone, not Hispanic or Latino | 30,483 | 62.4% | 6.6% |
| Population 20 to 64 years | 29,749 | 73.8% | 4.4% |
Sex
| Demographic characteristic | Total | Labor force participation rate | Unemployment rate |
|---|---|---|---|
| Male | 15,437 | 76.1% | 3.7% |
| Female | 14,312 | 71.2% | 5.2% |
Females with children
| Demographic characteristic | Total | Labor force participation rate | Unemployment rate |
|---|---|---|---|
| With own children under 18 | 3,530 | 67.6% | 2.9% |
| With own children under 6 only | 944 | 70.2% | 2.0% |
| With own children under 6 and 6 to 17 | 669 | 55.5% | 1.9% |
| With own children 6 to 17 only | 1,917 | 70.5% | 3.7% |
Poverty status in the past 12 months
| Demographic characteristic | Total | Labor force participation rate | Unemployment rate |
|---|---|---|---|
| Below poverty level | 7,891 | 53.8% | 13.2% |
| At or above the poverty level | 19,659 | 84.0% | 1.2% |
Disability status
| Demographic characteristic | Total | Labor force participation rate | Unemployment rate |
|---|---|---|---|
| With any disability | 3,116 | 53.1% | 7.5% |
Educational attainment
| Demographic characteristic | Total | Labor force participation rate | Unemployment rate |
|---|---|---|---|
| Population 25 to 64 years | 18,901 | 78.6% | 1.9% |
| Less than high school graduate | 654 | 50.6% | 9.4% |
| High school graduate (includes equivalency) | 2,495 | 72.1% | 2.0% |
| Some college or associate's degree | 5,857 | 75.6% | 2.8% |
| Bachelor's degree or higher | 9,895 | 83.8% | 1.2% |
Source: U.S. Census Bureau, American Community Survey 5-year estimates, S2301 | Employment Status
This workforce product was funded by a grant awarded by the U.S. Department of Labor's Employment and Training Administration. The product was created by the recipient and does not necessarily reflect the official position of the U.S. Department of Labor. The Department of Labor makes no guarantees, warranties, or assurances of any kind, expressed or implied, with respect to such information, including any information on linked sites and including, but not limited to, accuracy of the information or its completeness, timeliness, usefulness, adequacy, continued availability, or ownership. This product is copyrighted by the institution that created it. Internal use by an organization and/or personal use by an individual for non-commercial purposes is permissible. All other uses require the prior authorization of the copyright owner.