English | Español
QUICK LINKS
FREQUENTLY USED LINKS
RELATED LINKS
FORMS
CONTACT US
Monthly initial and continuing unemployment insurance claims report for December 2021
1/6/2022
FOR IMMEDIATE RELEASE – Jan. 6, 2022
CONTACT: media@ESD.WA.GOV
Still rising: 4-week moving average for regular initial and continued claims increased over the month
OLYMPIA – For the 4-week moving average ending Jan. 1, 2022, compared to the previous 4-week moving average:
- Regular initial claims increased by 1,826 to a total of 7,490. As with the previous 4-week moving average, the increase is likely due to seasonal layoffs, primarily in the construction and agriculture industries.
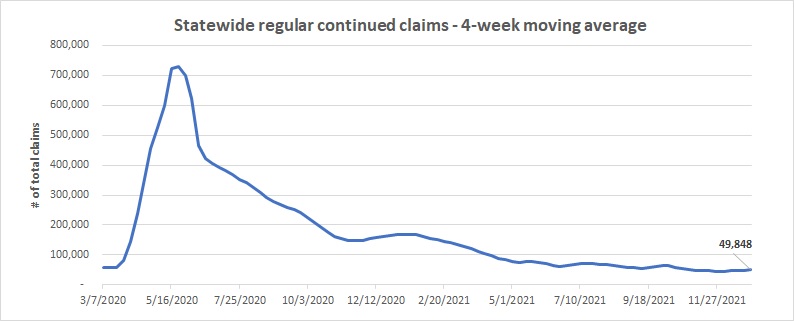
- Regular continued claims increased by 3,713 to a total of 49,848.
The increase in initial claims is typical for the agriculture and construction industries during this week in pre-pandemic times. And total initial claim volumes are still below pre-pandemic levels, indicating ongoing improvements in the overall labor market.
The 4-week moving average is designed to show trends over time. The data cover regular initial regular and continued claims for the weeks ending Dec. 11, Dec. 18, Dec. 25. and Jan. 1. See the tables below.
Continued claims are the total of all weeks benefits were claimed. See a more detailed definition in the Data disclaimer and definitions section below.
From Dec. 1 to Dec. 31, 2021, ESD paid more than $105.2 million in regular benefit payments to over 55,082 Washingtonians.
Last monthly initial claims news release: Look for future monthly data on our website
Due to unprecedented levels of initial unemployment claims at the start of the pandemic, ESD began sending weekly initial claims press releases in March 2020. In October 2021, we transitioned to monthly press releases when the number of weekly initial claims returned to pre-pandemic levels. Now that weekly initial claims are below pre-pandemic levels, ESD will no longer send the monthly press release. You can continue to find detailed claims data anytime on the ESD website.
For complete data showing weekly initial claims by industry sector and county for the year to date, also check the weekly unemployment initial claims charts. These charts are compiled by ESD’s Labor Market & Economic Analysis Division. For more information about specific counties, contact one of ESD’s regional local economists.
4-week summary of regular initial claims
Seasonal increases in layoffs in construction and farming, fishing and forestry occupations contributed to an increase of 1,826 regular initial claims over the previous 4-week average of regular initial claims in November 2021.
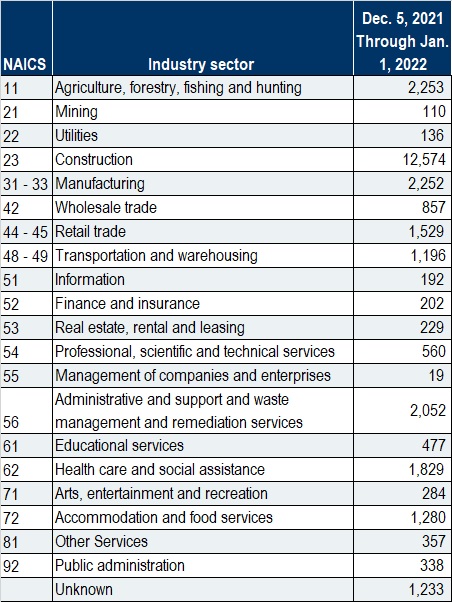
By industry
Industry sectors experiencing the highest number of regular initial claims during the 4-week period ending Jan. 1, 2022, were:
- Construction: 12,574.
- Agriculture, forestry, fishing and hunting: 2,253.
- Manufacturing: 2,252.
- Administrative and support and waste management and remediation services: 2,052.
- Retail trade: 1,529.
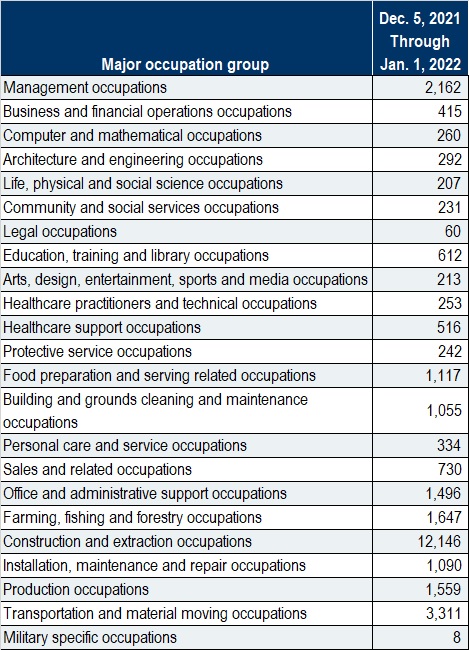
By occupation
Occupations experiencing the highest number of regular initial claims during the 4-week period ending Jan. 1, 2022, were:
- Construction and extraction occupations: 12,146.
- Transportation and material moving occupations: 3,311.
- Management occupations: 2,162.
- Farming, fishing, and forestry occupations: 1,647.
- Production occupations: 1,559.
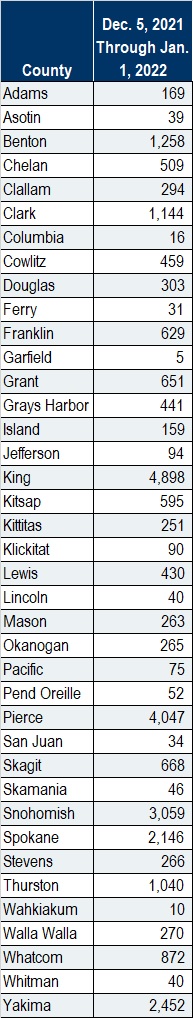
By county
King County, the most populous county in the state, had the largest amount of regular initial claims, 4,898, for the 4-week period ending Jan. 1, 2022.
Other counties with the largest number of initial claims:
- Pierce County: 4,047.
- Snohomish County: 3,059.
- Yakima County: 2,452.
- Spokane County: 2,142.
Table 1: 4-week moving averages
|
Unemployment claim type |
Week ending Jan. 1, 2022 |
Week ending Dec. 4, 2021 |
Week ending Jan. 2, 2021 |
Week ending Jan. 4, |
|
Regular unemployment insurance initial claims |
7,490 |
5,664 |
21,947 |
8,989 |
|
Continued or ongoing weekly claims for regular benefits |
45,162 |
50,848 |
148,638 |
49,528 |
|
Total – regular initial and continued claims |
50,623 |
56,120 |
165,841 |
57,410 |
Table 2: 4-week average of statewide regular initial claims filed since March 7, 2020
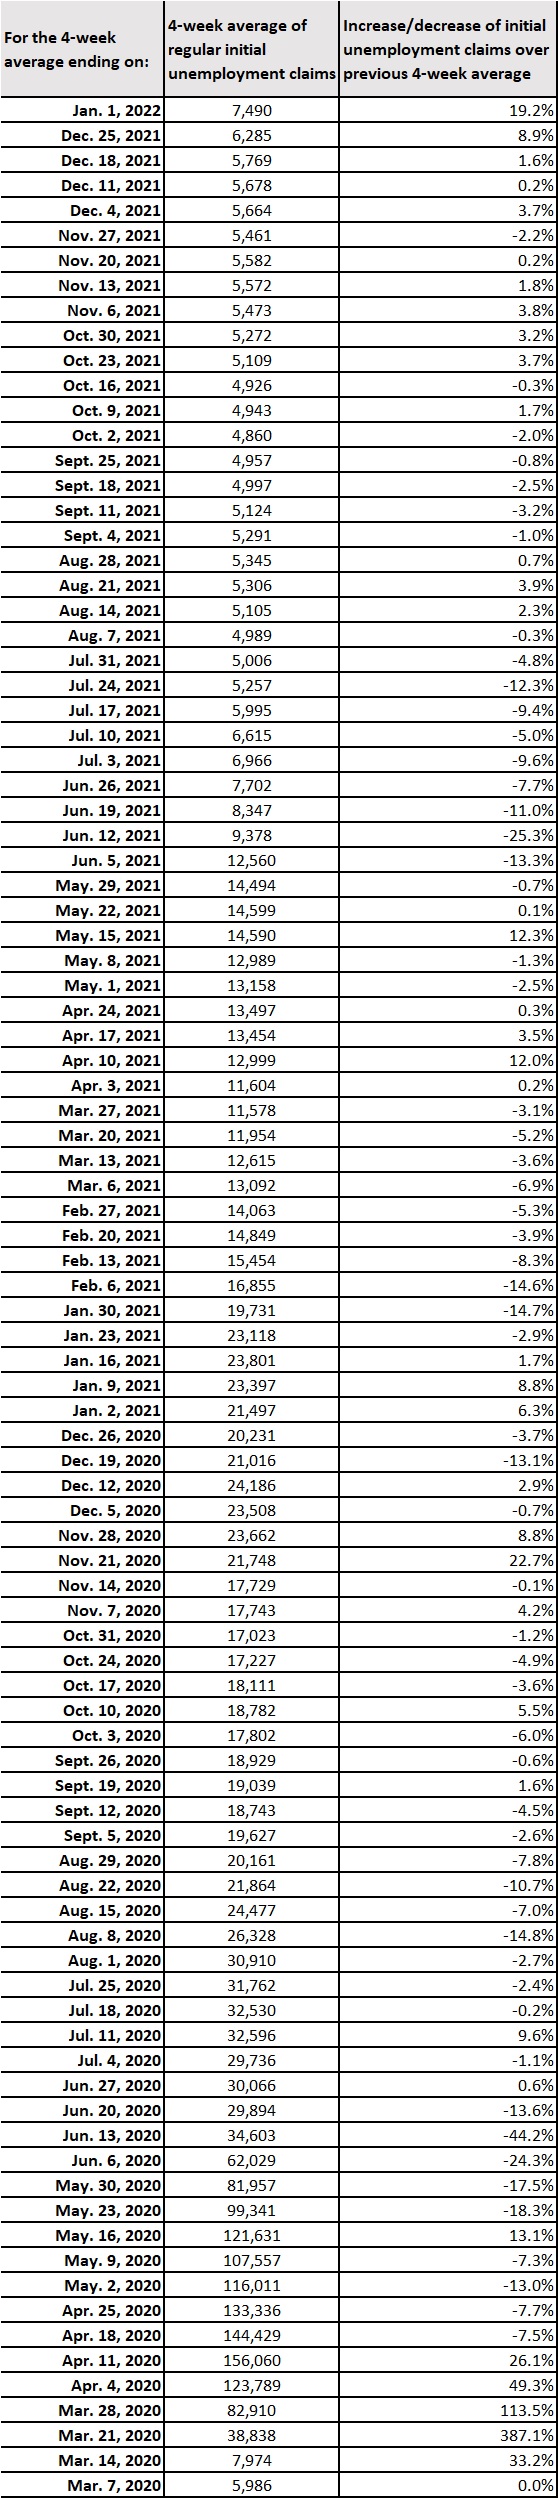
Table 3
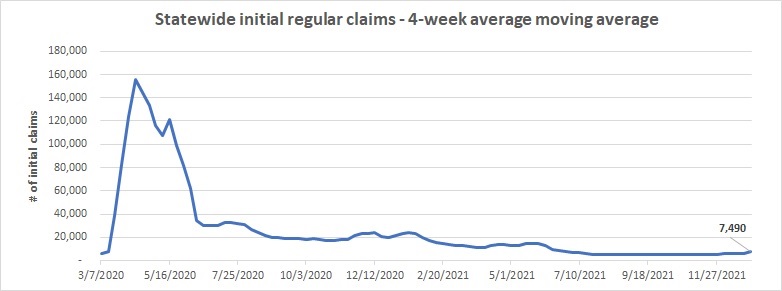
Table 4
Data disclaimer and definitions
Per U.S. Department of Labor regulations, weekly unemployment claims data are not available until the Thursday following the claim week.
Initial claims include:
- First-time claims.
- Additional claims filed as a result of a new unemployment event.
- Those still being reviewed for eligibility.
Counts for initial claims do not indicate eligibility or that ESD will pay benefits.
Continued claims are the total of all weeks benefits were claimed. The total does not necessarily mean that benefits were paid. Payment status might be uncertain or unknown for many reasons. For example, reasons might include status of waiting weeks, partial weeks, weeks with penalties issued, and weeks with monetary or nonmonetary issues pending.
4-week moving average is the average across the preceding 4-week period. Moving averages are used to smooth fluctuations in time.
Labor market web links
- Labor market information website
- Historical data (Excel spreadsheet)
- Historical claims data (Excel spreadsheets)
Appendix A
Total regular initial claims for the 4-week moving average ending Jan. 1, 2022
By industry sector
By major occupation group
By county