English | Español
QUICK LINKS
LMI HOMEPAGE
FREQUENTLY USED LINKS
TECHNICAL TOOLS AND STEM
EMPLOYMENT
UNEMPLOYMENT
WAGE
PAID FAMILY AND MEDICAL LEAVE
REPORTS AND RESEARCH
Whatcom County profile
 by Anneliese Vance-Sherman, Ph.D., regional labor economist - updated July 2022
Overview | Geographic facts | Outlook | Labor force and unemployment | Industry employment | Wages and income | Population | Useful links | PDF Profile copy
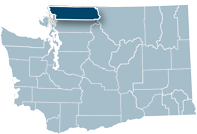
Regional context
Whatcom County is bordered to its north by British Columbia, Canada, Skagit County to its south and Okanagan County to its east. The Salish Sea lies to the west and the Cascade Mountains rise to the east. Whatcom County ranges in elevation from sea level to a high point at 10,781 feet at the active volcano Mount Baker, also known as Kulshan. In geological times past, the Fraser River in the lower mainland of British Columbia had one arm extending down to Bellingham Bay, creating the flat geography of a delta plain in that area that makes for productive farmland for dairies and berry growing.
Local economy
For thousands of years, Whatcom County has been home to people of the Lummi, Nooksack, Samish and Semiahmoo tribal groups. Fur trappers and traders from the Hudson’s Bay Company were the first non-native residents of the county. In the 1850s, Whatcom County experienced an economic and population boom propelled initially by coal mining, timber and agriculture.
Northwest Normal School, the predecessor to present day's Western Washington University (WWU) was established in Lynden in 1886. The northwest’s first high school was built in Whatcom County in 1890. This boom came to a halt in 1893 due to the national recession and the population in the Bellingham dropped to fewer than 50 individuals.
The 20th century brought in more prosperous times with increasing national demand for the abundant timber and salmon. Fish canning operations were a mainstay of the Whatcom County economy. The towns of Whatcom, Sehome, Bellingham and Fairhaven joined together to form the county seat of Bellingham. Whatcom County is now a regional hub for northwest Washington. Bellingham is the biggest city (both by population and area) in the region.
Agriculture is a steadying influence in the northern parts of the county. Today, farms in Whatcom County make up 4.0 percent of Washington’s agriculture sales. Whatcom County’s agricultural production is diverse, with notable berry and milk production.
The largest contributors to GDP in Whatcom County include manufacturing (especially nondurable goods), real estate, government and healthcare.
The pandemic-induced recession of 2020 interrupted the long arc of local employment growth. From February to April 2020, total nonfarm employment plummeted by about 15,200 jobs – nearly 15 percent. Total employment since April 2020 has shown remarkable recovery, with a great deal of variation by industry. Total employment continues to expand. As of May 2022 (preliminary), businesses located in Whatcom County collectively supplied nearly 94,600; about 2,500 jobs shy of pre-pandemic levels.
Whatcom County is home to Western Washington University as well as two community and technical colleges. The university and colleges are in their own right major employers, and Bellingham consistently draws a large student population which contributes to the local service economy.
The proximity to the Canadian border has a strong influence on the Whatcom County economy. When the Canadian dollar is strong, it creates demand as Canadian shoppers seek retail bargains and real estate in Whatcom County and travel from the Bellingham International Airport. In addition to local constraints, the border was effectively closed to travel across the border, with exceptions for the transport of essential goods and services. The COVID-19 pandemic hit Whatcom County’s labor market to a slightly greater extent than the state as a whole due in part to the loss of cross-border traffic.
| Whatcom County | Rank in state | |
| Land area, 2010 (square miles) | 2,106.9 | 12 |
| People per square mile, 2021 | 107.36 | 10 |
Source: Washington State Office of Financial Management
Whatcom County has some favorable factors that aided early job recovery following the Great Recession of 2008. In particular, the proximity of Whatcom County to Canada and the appreciated Canadian dollar during the jobs recession and early recovery created a draw for Canadian shoppers. Low cost flights to U.S. destinations has also created a draw for Canadian travelers. As the recovery progressed, the value of the Canadian dollar relative to the U.S. dollar has slid, reducing the draw of cross-border retail.
The very assets that were a strength in the leadup to the pandemic became vulnerabilities during the pandemic as the international border was closed to nonessential travel. The border remained closed until spring 2022, and opened with complex conditions around vaccines and testing. As border restrictions continue to ease, the question of “new normal” with regard to cross-border travel remains in the balance. Whatcom County’s economic recovery from the pandemic continues to lag behind the state.
Whatcom County generally has lower wage rates for many occupations compared to nearby counties along the I-5 corridor. This is partially due to the presence of a large student population and arguably makes the county attractive to manufacturing and service-providing firms to relocate or expand in the county.
Current labor force and unemployment statistics are available on the Labor area summaries page.
Whatcom County’s 2021 resident civilian labor force averaged 113,681, with an unemployment rate of 6.0 percent. Within this estimate, 106,859 Whatcom County residents were counted among the employed and 6,822 were counted among the unemployed (i.e., active job seekers).
The unemployment rate in Whatcom County declined rapidly after reaching a record high of 17.4 percent in April 2020. The average unemployment rate in 2021 was 6.0 percent.
The size of the Whatcom County civilian labor force in 2021 was smaller than the size of the labor force prior to the pandemic. In 2019, the average annual labor force was 116,635, with an unemployment rate of 5.1 percent. By comparison, the size of the labor force dropped by nearly 3,000 residents to 113,681 in 2021..
Source: Employment Security Department
Current industry employment statistics are available on the Labor area summaries page.
Whatcom County averaged 90,300 nonfarm jobs in 2021, up from the 2020 approximation of 88,400, but still below the pre-pandemic average of 95,900 in 2010. Payroll employment growth in Whatcom County has generally hovered in the 2.0 percent range from the great recession to the pandemic recession.
- Goods-producers contributed an average of 17,000 jobs to the Whatcom County economy in 2021.
- Despite dropping by about 500 jobs early in 2020, construction employment rebounded quickly in Whatcom County. Average annual employment in 2021 was nearly recovered, with a tally of 7,900 jobs.
- Manufacturing employment dropped from 10,700 to 9,600 in 2020, and continued to fall in 2021. Average annual employment in manufacturing was 9,100 in 2021; down 1,700 compared to 2019. The continued drop in manufacturing was similar to the pattern observed statewide, and largely a response to declining demand for aircraft as a result of the pandemic.
- Despite dropping by about 500 jobs early in 2020, construction employment rebounded quickly in Whatcom County. Average annual employment in 2021 was nearly recovered, with a tally of 7,900 jobs.
- Private service-providing employment averaged 56,400 in 2021; up about 2,000 jobs over the year, but still about 2,200 below the average annual employment tally in 2019. All private service-providing sectors captured in the nonfarm employment report recovered jobs over the year.
- Government employment in Whatcom County is concentrated in local and state government and includes public K-12 and post-secondary education. Tribal government is also included. Total government employment expanded by only 100 or 0.8 percent from 2020 to 2021, with one-year losses observed in state and local government.
For historical industry employment data, contact an economist.
Source: Employment Security Department
Industry employment by age and gender
The Local Employment Dynamics (LED) database, a joint project of state employment departments and the U.S. Census Bureau, matches state employment data with federal administrative data. Among the products is industry employment by age and gender. All workers covered by state unemployment insurance data are included; federal workers and non-covered workers, such as the self-employed, are not. Data are presented by place of work, not place of residence.
Whatcom County highlights:
Whatcom County’s labor market tends to reflect higher concentrations of youth than Washington state. Thirteen point 4 percent of the employed workforce in Whatcom County was between age 14 and 24 in 2020. Compare to 10.6percent statewide. This reflects the high student population residing in Bellingham.
Employment was split almost evenly between men and women in 2021, with 50.4 percent of jobs being occupied by men and 49.6 percent occupied by women.
- Top male-dominated industries included construction (83.2 percent), manufacturing (71.8 percent) and wholesale trade (71.1 percent).
- Female-dominated industries included healthcare and social assistance (78.3 percent), educational services (68.2 percent) and finance and insurance (66.8 percent).
Source: The Local Employment Dynamics
In 2020, Whatcom County averaged 85,262 jobs covered by unemployment insurance, with a payroll of more than 4.5 billion dollars.
The county’s 2020 average annual wage was $53,325; below the statewide annual average wage of $73,504 and above the national average wage of $50,834.
In 2018, the county’s median hourly wage was $24.71, lower than the state median of $25.01 per hour.
Personal income
Personal income includes earned income, investment income, and government payments such as Social Security and Veterans Benefits. Investment income includes income imputed from pension funds and from owning a home. Per capita personal income equals total personal income divided by the resident population.
Average per capita personal income in 2020 was lower in Whatcom County ($59,510) than the state ($67,126) but higher than the U.S. ($52,787), according to the Bureau of Economic Analysis. Of Washington’s 39 counties, Whatcom County ranked 14th for per capita income.
According to the U.S. Census Bureau, Whatcom County’s 2019 median household income was $65,712, less than Washington state ($78,687) and less than the U.S. ($69,372).
In 2019, 12.9 percent of Whatcom County’s resident population was living below the official poverty line, higher than the state (9.8 percent) and similar to the nation (12.3 percent).
Source: Employment Security Department/DATA Division; Bureau of Labor Statistics; Bureau of Economic Analysis; U.S. Census Bureau; U.S. Census Bureau, American Community Survey
Whatcom County’s estimated population was 226,300 in 2021, according to the Washington state Office of Financial Management. Total population growth from 2011 to 2021 was 11.9 percent, below the percentage growth rate for Washington state over the same period.
The largest city in Whatcom County is Bellingham (89,860 in 2021, up 10.9 percent in 10 years). The next largest cities are Lynden, Ferndale, Blaine and Everson
Population facts
| Whatcom County | Washington state | |
| Population 2021 | 226,300 | 7,766,975 |
| Population 2011 | 202,277 | 6,781,551 |
| Percent change, 2011 to 2021 | 11.9% | 14.5% |
Source: Washington State Office of Financial Management
Age, gender and ethnicity
The proportion of very young children is less in Whatcom County than the state, however due to the presence of Western Washington University, Bellingham Technical College and Whatcom Community College, the population of residents between the ages of 15 and 24 make up about 17.0 percent of the total population in Whatcom County; compared to about 13.0 percent statewide.
There were proportionately more residents aged 60 years and older in Whatcom County relative to the whole state.
Females made up 50.6 percent of the population, slightly higher than the state in 2019.
Whatcom County has a larger percentage of American Indian and Alaska Native residents than the state. Otherwise, it is slightly less racially and ethnically diverse than the state.
Demographics
| Whatcom County | Washington state | |
| Population by age, 2019 | ||
| Under 5 years old | 5.1% | 6.0% |
| Under 18 years old | 19.2% | 21.8% |
| 65 years and older | 18.0% | 15.9% |
| Females, 2019 | 50.6% | 49.9% |
| Race/ethnicity, 2019 | ||
| White | 86.2% | 78.5% |
| Black | 1.3% | 4.4% |
| American Indian, Alaskan Native | 3.4% | 1.9% |
| Asian, Native Hawaiian, other Pacific Islander | 5.1% | 10.4% |
| Hispanic or Latino, any race | 9.8% | 13.0% |
Educational attainment
In 2019, 92.8 percent of Whatcom County residents age 25 and older graduated high school compared to 91.3 percent across Washington state.
For Whatcom County residents, 34.3 percent have bachelor’s degrees or higher levels of education, which is proportionally lower than the state (36.0 percent) but higher than the nation (32.1 percent).
Source: U.S. Census Bureau QuickFacts
- County data tables
- Census Bureau County Profile
- 2020 Census State Profile
- Center for Business and Economics Research, Western Washington University
- Choose Whatcom
- Whatcom County history
- Northwest Washington Labor Market Review (Monthly)
- Northwest Workforce Council
- Port of Bellingham
- Census Bureau QuickFacts
- Whatcom Council of Governments
- Whatcom County home page
- Whatcom County on ofm.wa.gov
- Whatcom County on ChooseWashington.com
- Workforce Development Areas and WorkSource Office Directory
- Self Sufficiency Calculator for Washington State
- Whatcom County Agriculture Census
- Whatcom Conservation District