English | Español
QUICK LINKS
LMI HOMEPAGE
FREQUENTLY USED LINKS
TECHNICAL TOOLS AND STEM
EMPLOYMENT
UNEMPLOYMENT
WAGE
PAID FAMILY AND MEDICAL LEAVE
REPORTS AND RESEARCH
Walla Walla County profile
 by Ajsa Suljic, regional labor economist - updated June 2022
Overview | Geographic facts | Outlook | Labor force and unemployment | Industry employment | Wages and income | Population | Useful links | PDF Profile copy
Regional context
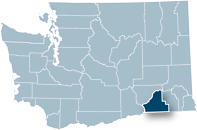
Walla Walla County was formed in 1854 and was named after the Walla Walla tribe of Native Americans. Walla Walla covers 1,271 square miles of land, ranking 26th in size among Washington’s 39 counties. Located in southeastern Washington, it is bordered by Columbia to the east, Franklin to the northwest, Benton on the west and Umatilla County, Oregon on the south. Walla Walla County has a population density of 46.3 persons per square mile and is home to one of the oldest communities in the state.
Walla Walla’s agricultural industry is the backbone of its economic vitality. Wheat, onions, potatoes and wine grapes are some of crops that are grown in Walla Walla County. In the past few years, Walla Walla has become one of the main attractions for wine and arts tourism as the area gets national and world recognition for its quality wine.
Local economy
The Cayuse, Walla Walla and Umatilla tribes were well established at the eastern end of the Columbia River basin. With abilities to travel the surrounding area for trading, some of the tribes acquired horses, which they later used for breeding or for sale or trade. Later, trading became one of the primary economic activities as fur and goods trading companies moved into the area with the pioneers. As pioneers started settling in the area, agricultural and ranching activities prospered as demand for produce and meats grew with a new influx of gold rush pioneers.
Walla Walla County went through many changes in the late 1800’s, however it has cultivated a flourishing community which is home to the first and oldest college, bank and newspaper in the state. Walla Walla County was added to the railroad grid with a 30-mile line connection in 1875, as the need for local agricultural products increased with the creation of new settlements in the west. Also, in 1887, Walla Walla became home to one of the first territorial prisons in the state, where government became a major employing industry in the area.
Considering its size and isolation, the Walla Walla economy has a diverse industrial makeup. The five largest sectors are: agriculture, healthcare, manufacturing, retail trade and government (educational) services, which make up over 71.0 percent of total employment. Walla Walla County has also become a tourist attraction and destination as people are attracted to the mild climate, low cost of living and high quality of life.
With over 181 wineries located in the valley, Walla Walla County has become a wine destination and important viticulture area. Tourism will continue to drive growth in food, accommodations and wine sales. Local agriculture is the fourth-largest industry in the area, and it is growing about 0.9 percent a year, with very strong tree fruit production and dry land crops.
| Walla Walla County | Rank in state | |
| Land area, 2010 (square miles) | 1,270.1 | 26 |
| People per square mile, 2010 | 46.3 | 17 |
Source: U.S. Census Bureau QuickFacts
Walla Walla County covered employment decreased by 1.5 percent in 2020 due to COVID-19 pandemic closures. Employment growth slowed down in 2019 to 0.1 percent over the year. Over the past five years the county expanded by 2.4 percent overall. Covered employment volatility from year to year has shown areas of resiliency and weaknesses to large industry restructuring, seasonal and trade changes. In 2020, the county had 15 industries decreasing, five industries which increased.
Industries that have maintained stability in Walla Walla County for the past five years include: construction, manufacturing, transportation and warehousing, wholesale trade, real estate, rental and leasing, arts and entertainment, and government.
For the next five years, industries that are expected to drive growth in the county are professional and business services, private education and health care services, information and financial activities and other business and population services and construction. Walla Walla County, as part of the Eastern Washington workforce development area, is expected to grow 0.4 percent a year through 2024 and 0.8 percent a year from 2024 to 2029.
Current labor force and unemployment statistics are available on the Labor area summaries page.
The Walla Walla County labor force was estimated at 31,574 in 2021, which is about 1.7 percent more than in 2020. Resident employment increased by 3.9 percent over the year. The number of people who were unemployed and looking for work totaled at 1,456 with a decrease over the year of about 28.9 percent. The Walla Walla County unemployment rate was 4.6 percent in 2021, which was 2.0 percent less than in 2020.
During the past twelve years, the average annual unemployment rate peaked in 2010 and 2011 at 8.0 percent and hit a low in 2008 of 5.2 percent. In 2021, the unemployment rate reached a new record low of 4.6 percent. The unemployment rate fluctuates throughout the year, reflecting the seasonal employment trends.
Source: Employment Security Department/DATA Division; County data tables
Current industry employment statistics are available on the Labor area summaries page.
Total covered employment in Walla Walla County was 27,448 in 2020, with a decrease of 1.5 percent, or 407 jobs since 2019. Walla Walla County total covered payrolls totaled at $1.33 billion in 2020, with average annual wages for covered employment at $48,431 in 2020, an increase of 4.8 percent from 2019, when the average annual wage was $46,198.
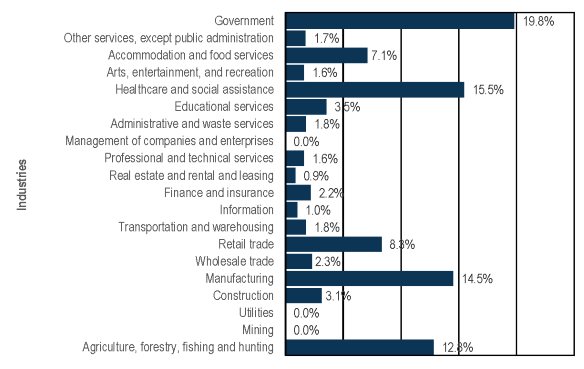
Industries by percent share of total employment
According to the BLS’ Quarterly Census of Employment and Wages, there were over 2,140 total establishments in Walla Walla County.
Goods-producing industries, which include agriculture and natural resources, mining, construction and manufacturing, decreased in employment from 2019 to 2020 by 2.7 percent, or by 226 jobs. Average employment in 2020 was 8,259 workers and annual payrolls totaled $421.5 million, which translated to a $51,034 average annual wage for goods-producing workers. This represents about 30.5 percent of total employment.
- The manufacturing industry employment decreased by 2.8 percent over the year. Manufacturing represented 14.3 percent of total covered employment. The average employment was 3,932 jobs in 2020, with total covered payrolls at $245.7 million and an average annual payroll of $62,478.
- Construction accounted for 3.4 percent of the total average annual employment in the county with 929 jobs. Over the year, construction increased by 6.9 percent in employment. The average annual wage in construction was $53,436 in 2020, with an increase over the year by 11.4 percent.
- Agriculture is one of the primary industries in the area, representing 12.4 percent of total employment. It is, however, highly seasonal and volatile from year to year.
- Average annual employment in agriculture in 2020 was 3,396, with a decrease over the year of 4.8 percent. Average annual wage in agriculture was $35,141, mainly due to the seasonality of agricultural activities. Average annual wage increased by 7.0 percent over the year.
- Service-providing industries are the major share (69.5 percent) of the Walla Walla County economy. They had an average of 19,191 jobs, which paid an average annual wage of $47,298 in 2020.
- The Walla Walla County finance and insurance industry provided on average 621 jobs. The average annual wage for this industry was $65,638 (an increase of 16.3 percent over the year). Finance and insurance is the fourth-highest paying industry in the area and makes up 2.3 percent of total employment in the county.
- Retail trade is the fifth-largest industry in Walla Walla County, representing 8.5 percent of total employment. Employment growth was recorded in food and beverage stores as well as general merchandise stores, which dominate the retail trade industry. In 2020, this industry had an average of 2,332 jobs and paid an average annual wage of $30,795, which increased by 8.5 percent over the year.
- The administrative and waste services industry totaled 484 jobs in 2020 with a 1.8 percent decrease over the year. Total annual payroll for this industry was at $14.6 million, which translates to an average annual wage of $30,126, which increased by 4.1 percent over the year.
- Health care and social assistance employment in the private sector had 4,285 jobs, which represented about 15.6 percent of total employment in 2020, making it the second-largest industry in the area.
- Over the year, this industry decreased by 0.6 percent.
- Total annual payroll in Walla Walla County was at $224.0 million, translating to an average annual wage of $52,285, with an increase over the year of 4.1 percent or $2,071 dollars.
- Government made up 21.7 percent of total employment with 5,946 jobs in 2020. It provided public education, health care, social services, safety and many other services in the county. Total annual payroll was at $329.1 million. It provided an average annual wage of $55,347, which decreased by 6.4 percent over the year.
For historical industry employment data, contact an economist.
Source: Employment Security Department/ DATA Division; County data tables
Industry employment by age and gender
The Local Employment Dynamics (LED) database, a joint project of state employment departments and the U.S. Census Bureau, matches state employment data with federal administrative data. Among the products is industry employment by age and gender. All workers covered by state unemployment insurance data are included; federal workers and non-covered workers, such as the self-employed, are not. Data is presented by place of work, not place of residence.
Walla Walla County highlights:
In 2020, the largest share of employment in Walla Walla County was held by those 34 to 44 years old at 21.6 percent. Those aged 25 to 34 year-olds newly entering the workforce were close with a 20.1 percent share of total employment. The 45 to 54 year-olds made up 20.0 percent of total employed in the county.
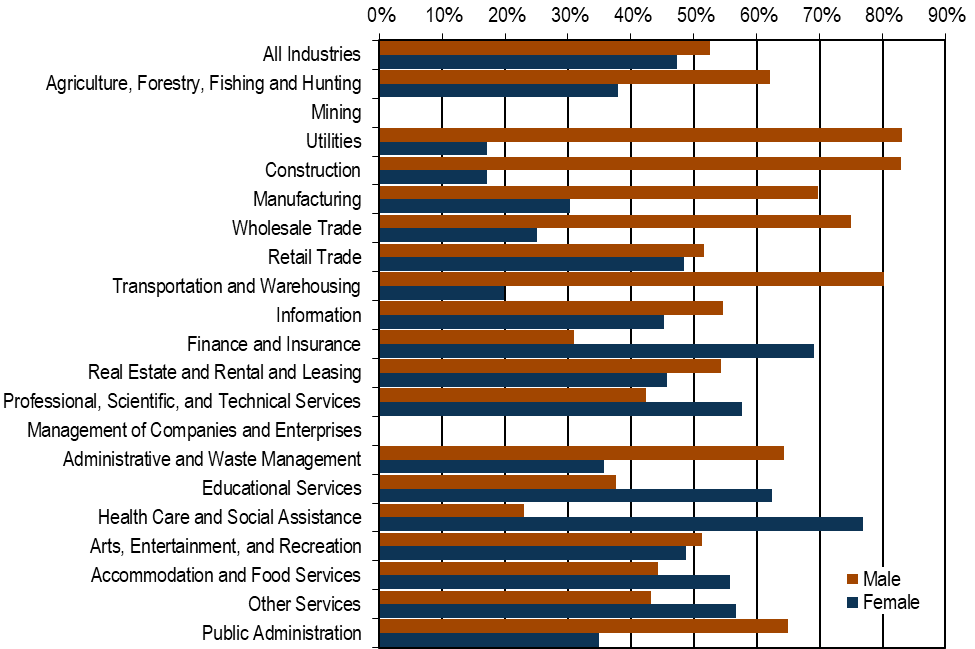
Walla Walla County employment in 2020 included 52.6 percent male workers and 47.4 percent female workers. Industry differences are discussed below:
- Male-dominated industries included construction (82.9 percent), utilities (83.1 percent), transportation and warehousing (80.3 percent), wholesale trade (74.9 percent) and manufacturing (69.7 percent).
- Female-dominated industries included health care and social assistance (77.0 percent), finance and insurance (69.0 percent), educational services (62.4 percent), and professional and technical services (57.7 percent).
Percent of industry jobs by gender in Walla Walla County for 2020
Source: Employment Security Department/DATA Division; County data tables
In 2020, there were 27,450 jobs in Walla Walla County covered by unemployment insurance, with a total payroll of over $1.33 billion.
- The average annual wage was $48,423, well below the state’s average annual wage of $73,504 or state, less King County of $50,834. The median hourly wage in 2020 was $22.36 below the state’s median hourly wage of $29.28.
- Median household income was $60,615 in 2020. This is much lower than the state average of $77,006.
- In 2020, workers earned over 11.4 percent of their total wages working outside of the county, and an estimated 17.5 percent of county payrolls goes to earners who live outside the county.
Source: Employment Security Department DATA Division; County data tables; U.S. Census Bureau QuickFacts
Personal income
Personal income includes earned income, investment income, and government payments such as Social Security and Veterans Benefits. Investment income includes income imputed from pension funds and from owning a home. Per capita personal income equals total personal income divided by the resident population.
- Per capita income in Walla Walla County was $51,767 in 2020 (an increase of 11.0 percent over the year), which is 86.9 percent of the U.S. average ($59,510) and 77.1 percent of Washington’s average ($67,126).
- Investment income was 19.0 percent of per capita total income in 2020.
- Government transfer payments, as a proportion of total income, have risen steadily from 11.0 percent in 1969 to 26.0 percent in 2020.
- The poverty rate for Walla Walla County in 2020 was estimated at 12.9 percent, above the state’s poverty rate of 9.5 percent and the national poverty rate of 11.4 percent.
In 2021, Walla Walla County’s population was 62,682 showing 6.6 percent growth from 2010 to 2021, compared to the state’s growth rate of 15.1 percent.
The largest city in Walla Walla County is the city of Walla Walla with a population of 33,927 in 2021.
Source: Employment Security Department/DATA Division; County data tables; U.S. Census Bureau QuickFacts
Population facts
| Walla Walla County | Washington state | |
| Population 2021 | 62,682 | 7,738,692 |
| Population 2010 | 58,781 | 6,724,540 |
| Percent change, 2010 to 2019 | 6.6% | 15.1% |
Source: U.S. Census Bureau QuickFacts
Age, gender and ethnicity
Walla Walla County population demographics differed from the state’s in 2020.
- Walla Walla County’s population under 18 years of age was 20.7 percent of the total compared to 21.8 percent for the state.
- Residents under the age of 5 years old made up 5.3 percent of the total population compared to 6.0 percent for the state.
- Walla Walla County’s population 65 years and older made up 18.7 percent of the total compared to 15.9 percent for the state.
The county was 49.1 percent female compared 49.9 percent for the state in 2019.
Walla Walla County differed from the state in racial and ethnic diversity in most categories in 2019. Hispanics and Latinos were 21.7 percent of the population compared with 13.0 percent in the state.
Demographics
| Walla Walla County | Washington state | |
| Population by age, 2021 | ||
| Under 5 years old | 5.5% | 6.0% |
| Under 18 years old | 20.7% | 21.8% |
| 65 years and older | 18.7% | 15.9% |
| Females, 2021 | 49.1% | 49.9% |
| Race/ethnicity, 2021 | ||
| White alone, not Hispanic or Latino | 71.3% | 67.5% |
| Black | 2.2% | 4.4% |
| American Indian, Alaskan Native | 1.4% | 1.9% |
| Asian, Native Hawaiian, other Pacific Islander | 2.1% | 10.4% |
| Hispanic or Latino, any race | 21.7% | 13.0% |
Source: U.S. Census Bureau QuickFacts
Educational attainment
About 87.8 percent of Walla Walla County’s population 25 years and older were high school graduates over the period 2016 to 2020. This graduation rate compares to 91.7 percent for the state.
Over the same period, those holding a bachelor’s degree or higher made up 28.6 percent of Walla Walla County residents age 25 and older compared to 36.7 percent of state residents.
Source: U.S. Census Bureau QuickFacts
- County data tables
- Census Bureau County Profile
- 2020 Census State Profile
- Walla Walla County on ChooseWashington.com
- Walla Walla County on ofm.wa.gov
- Walla Walla County History
- Walla Walla County homepage
- Eastern Washington Partnership Workforce Development Council
- Demographics and economic trends
- Port of Walla Walla
- Walla Walla Valley Wine Cluster – Economic Development project reports and Links
- Self Sufficiency Calculator for Washington State
- Census Bureau QuickFacts
- Washington Ports
- Workforce Development Areas and WorkSource Office Directory