English | Español
QUICK LINKS
LMI HOMEPAGE
FREQUENTLY USED LINKS
TECHNICAL TOOLS AND STEM
EMPLOYMENT
UNEMPLOYMENT
WAGE
PAID FAMILY AND MEDICAL LEAVE
REPORTS AND RESEARCH
Skagit County profile
 by Anneliese Vance-Sherman, Ph.D., regional labor economist - updated May 2022
Overview | Geographic facts | Outlook | Labor force and unemployment | Industry employment | Wages and income | Population | Useful links | PDF Profile copy
Regional context
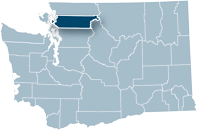
Skagit County, located in northwest Washington, is situated between Whatcom County to the north and Snohomish County to the south. The Salish Sea lies to the west and the Cascade Mountains rise to the east. The Skagit River runs through the largest population centers of the county. Although most of Skagit County is continental, several islands in the Salish Sea are also considered part of Skagit County.
Skagit County ranges in elevation from sea level to a high point of 9,114 feet at the non-volcanic peak, Mount Buckner. Glacier Peak, located in neighboring Snohomish County, is noted by the U.S. Geologic Survey as one of the “most active and explosive of Washington’s volcanoes.” Glacier Peak shaped the geography of the Skagit River valley through tremendous mud and debris flows (lahars) that have at times traveled well over 100 miles to reach the Salish Sea.
Skagit County is designated as the Mount Vernon – Anacortes Metropolitan Statistical Area (MSA) and is a part of the broadest Combined Statistical Area (CSA) for the Seattle region.
Locally, Skagit County is best known for its agriculture, however in 2019 the U.S. Bureau of Economic Analysis (BEA) estimated that manufacturing was the largest contributor to county real gross domestic product (GDP). Manufacturing accounted for 30.0 percent of total GDP for the Mount Vernon – Anacortes MSA. Agriculture, forestry, fishing and hunting accounted for 5.1 percent of GDP.
Local economy
The Coast Salish Native Americans have lived in the Skagit River valley and the Ross Lake area for millennia. The abundant fisheries and shellfish provided the major sources of protein for the Coast Salish, while fiddleheads from bracken ferns were encouraged by managed fires and camas were cultivated for their bulbs.
Settlement by non-natives began in earnest in the 1860s. Agriculture got its start when settlers discovered that creating dikes to hold back the Skagit River made much of the land suitable for farming. Logging and mining were also major industries.
The 1890s brought fish canneries, which prolonged the early development boom. County agriculture later expanded to seed production and eventually tulip growing. With the advent of modern vegetable freezing, agricultural production expanded further. Dairy production is also a large part of farming in the county today.
Like the national economy, Skagit County’s largest job-providing sector is the private service-providing sector, making up about 56.3 percent of total nonfarm employment in 2021. This share of employment has not changed substantially over the past several years. Goods providing sectors made up 20.7 percent and government employers (including K-12 education) provided 23.0 percent of total nonfarm employment.
The county has some heavy industry including oil refineries in Anacortes and several manufacturers that support the marine and aerospace industries, food manufacturing and other niche manufacturing businesses that contribute to a fairly well-rounded economy.
| Skagit County | Rank in state | |
| Land area, 2010 (square miles) | 1,731.2 | 21 |
| People per square mile, 2021 | 75.13 | 14 |
Source: Washington State Office of Financial Management
In the lead up to the pandemic-induced recession of 2020, Skagit County had experienced several years of growth reflected in each major industry sector. The sudden downturn affected Skagit County to a greater extent than either Washington state or the nation. From 2019 to 2020, Skagit County total nonfarm employment dropped by 4,200 or 7.9 percent; for comparison, Washington state and the U.S. total nonfarm employment dropped by 5.4 and 5.8 percent respectively. All major industry sectors saw net losses in 2020.
From 2020 to 2021, Skagit County employment began to rebound. Total nonfarm employment expanded by 800 jobs or 1.6 percent. Job losses in manufacturing continued into 2021, and construction neither added nor shed jobs. Service-providing industries collectively recovered 700 jobs with the largest gains attributable to the industry sector that had suffered the deepest losses: leisure and hospitality.
Skagit County employment appears to be recovering from the brief but impactful COVID-19 recession for the most part, however each industry sector remains below pre-pandemic levels. This is not new for Skagit County. Skagit County lagged behind the state in recovery from the Great Recession and, true to form, is lagging behind the statewide recovery today.
Current labor force and unemployment statistics are available on the Labor area summaries page on ESD’s labor market information website.
Skagit County’s unemployment rate tends to be higher than both the state and the nation in any given moment in time, but the overall trends track closely with the state. During the COVID-19 pandemic-induced recession, Skagit County’s unemployment peaked at 18.8 percent, then rapidly dropped to the 6.0 percent range throughout 2020 and 2021. As of March 2022, the unemployment rate was 6.0 percent.
In 2021, the Skagit County labor force averaged 61,943 workers, of which 58,039 were counted among the employed and 3,904 were unemployed.
Source: Employment Security Department
Current industry employment statistics are available on the Labor area summaries page on ESD’s labor market information website.
- Skagit County had an average of 49,200 nonfarm jobs in 2021, up 800 or 1.6 percent from the level observed in 2020. Washington state as a whole saw the addition of 74,700 jobs over the year, an increase of 2.3 percent.
- Skagit County’s goods-producing industries shed 1,000 jobs from 2019 to 2020, and another 200 jobs in 2021. Construction losses were swift and deep (700 jobs in 2020), and have yet to recover. Manufacturing losses were more shallow, but prolonged. Manufacturing employment dropped by 500 jobs in 2020 and 2021.
- Private service-providing employment averaged 27,700 in 2021. From 2019 to 2020, private sector service providers collectively shed 2,300 jobs. By 2021, the collection of sectors had recovered 700 jobs.
- The leisure and hospitality sector suffered the deepest losses of any service-providing sector; 1,100 jobs. From 2020 to 2021, the sector recovered 400 jobs.
- Trade, transportation and utilities (a sector that includes retail trade) lost 500 jobs (400 of which were in retail) and recovered 200 (retail) jobs in 2021.
- Government employment in Skagit County is concentrated in local government and includes public K-12 education in addition to county, local and tribal government functions. Government employment contracted by 800 jobs from 2019 to 2020. Two hundred jobs were recovered in 2021. Gains were attributable to local government.
For historical industry employment data, contact an economist.
Source: Employment Security Department/DATA Division
Industry employment by age and gender
The Local Employment Dynamics (LED) database, a joint project of state employment departments and the U.S. Census Bureau, matches state employment data with federal administrative data. Among the products is industry employment by age and gender. All workers covered by state unemployment insurance data are included; federal workers and non-covered workers, such as the self-employed, are not. Data are presented by place of work, not place of residence.
Skagit County highlights:
In 2020, job holders in Skagit County’s labor market were, on average, slightly older than Washington job holders. Statewide, 23.0 percent of the workforce was age 55 or older, compared with Skagit County where 25.9 percent of the workforce was age 55 or older. Skagit County’s proportional employment of youth was slightly higher than the state in 2020 (youth ages 14 to 24 represented 11.5 percent of Skagit County employment, compared to 10.6 percent statewide).
Employment for women and men in Skagit County was roughly equivalent (50.9 percent male and 49.1 percent female). In this respect, Skagit County is also statistically similar to the state (51.5 percent and 48.5 percent male and female respectively).
- Male-dominated industries in Skagit County included construction (82.4 percent), mining (81.5 percent), transportation and warehousing (77.9 percent), manufacturing (75.3 percent), and utilities (72.6 percent).
- Female-dominated industries included health care and social assistance (78.4 percent), educational services (72.4 percent) and finance and insurance (71.1 percent).
Source: The Local Employment Dynamics
In 2020, Skagit County averaged 48,844 jobs covered by unemployment insurance, with a total payroll of nearly $2.65 billion dollars.
The county’s 2020 average annual wage was $54,320.
In 2020, Skagit County’s median hourly wage was $25.74, lower than the state median of $29.28.
Personal income
Personal income includes earned income, investment income, and government payments such as Social Security and Veterans Benefits. Investment income includes income imputed from pension funds and from owning a home. Per capita personal income equals total personal income divided by the resident population.
In 2020, per capita personal income in Skagit County was $57,315, below both the state ($67,126) and the U.S. ($59,510). Compared to other counties throughout Washington state, Skagit County ranked 9th (out of 39) for highest personal income.
According to the U.S. Census Bureau, Skagit County’s median household income in 2020 was $71,012; below the state median household income ($77,006), but above the national median ($64,994).
In 2020, 9.5 percent of Skagit County’s population was estimated to be living below the official poverty line. The statewide average was also 9.5 percent, while the national average stood at 11.4 percent. The poverty rate for children under the age of 18 years old in Skagit County was 21.5 percent.
Source: Employment Security Department; Bureau of Labor Statistics; Bureau of Economic Analysis; U.S. Census Bureau; U.S. Census Bureau, American Community Survey
Skagit County’s population was estimated to be 130,000 in 2021. The county’s population expanded 10.5 percent from 2011 to 2021. This was lower than the statewide population growth rate of 14.5 percent over the same time period.
The largest city and county seat of Skagit County is Mount Vernon (population 35,390 in 2021), up 11.1 percent over 10 years. The next largest cities are Anacortes, Sedro-Woolley, Burlington and La Conner respectively. The fastest-growing municipality is Sedro-Woolley.
Population facts
| Skagit County | Washington state | |
| Population 2021 | 130,000 | 7,766,975 |
| Population 2011 | 117,617 | 6,781,551 |
| Percent change, 2011 to 2021 | 10.5% | 14.5% |
Source: Washington State Office of Financial Management
Age, gender and ethnicity
The age distribution of Skagit County residents compared to the state and the nation reflects a smaller early to mid-career working-age population and a larger 55 and older population. The proportion of children age 0 to 18 is similar to that of the state and the nation.
Compared to the state, a greater proportion of Skagit County residents identify as white (90.3 percent) compared to 78.5 percent. Looking at ethnicity, Skagit County has a greater proportion of Hispanic or Latino residents (18.6 percent compared to 13.0 percent statewide).
Demographics
| Skagit County | Washington state | |
| Population by age, 2020 | ||
| Under 5 years old | 5.8% | 6.0% |
| Under 18 years old | 21.5% | 21.8% |
| 65 years and older | 21.5% | 15.9% |
| Females, 2020 | 50.5% | 49.9% |
| Race/ethnicity, 2020 | ||
| White | 90.3% | 78.5% |
| Black | 1.1% | 4.4% |
| American Indian, Alaskan Native | 2.7% | 1.9% |
| Asian, Native Hawaiian, other Pacific Islander | 2.7% | 10.4% |
| Hispanic or Latino, any race | 18.6% | 13.0% |
Source: U.S. Census Bureau QuickFacts
Educational attainment
In Skagit County, 90.6 percent of adults age 25 and older during the period 2016 to 2020 were estimated to have graduated from high school. This compares to 91.7 percent for Washington state and 88.5 percent nationally.
There were proportionately fewer residents in Skagit County with college degrees than in the state. Slightly more than 27.4 percent of Skagit County residents age 25 and up had completed bachelor’s degrees or higher, compared to 36.7 percent for the state.
Source: U.S. Census Bureau QuickFacts
- County data tables
- Census Bureau County Profile
- 2020 Census State Profile
- Center for Business and Economics Research, Western Washington University
- Economic Development Alliance of Skagit County
- History of Skagit County
- Northwest Washington Labor Market Review (Monthly)
- Northwest Workforce Development Council
- Port of Anacortes
- Port of Skagit County
- Skagit Council of Governments
- Skagit County Extension
- Skagit County home page
- Skagit County on ChooseWashington.com
- Skagit County on ofm.wa.gov
- U.S. Bureau of Economic Analysis Regional Economic Accounts
- Self Sufficiency Calculator for Washington State
- U.S. Census Bureau QuickFacts
- Workforce Development Areas and WorkSource Office Directory