English | Español
QUICK LINKS
LMI HOMEPAGE
FREQUENTLY USED LINKS
TECHNICAL TOOLS AND STEM
EMPLOYMENT
UNEMPLOYMENT
WAGE
PAID FAMILY AND MEDICAL LEAVE
REPORTS AND RESEARCH
Mason County profile
 by Jim Vleming, regional labor economist - updated May 2022
Overview | Geographic facts | Outlook | Labor force and unemployment | Industry employment | Wages and income | Population | Useful links | PDF Profile copy
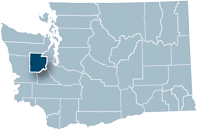
Regional context
The county now known as Mason was first established as Sawamish County in 1854. Carved out of Thurston County, it extended to the Pacific Ocean. In 1864, it was renamed Mason County. It encompasses the southern part of Hood Canal and many bays and inlets of south Puget Sound. The indigenous peoples include the Coast Salish. European contact in the 1700s brought disease that decimated the native populations. In the 1840s, American settlers arrived and began farming.
Local economy
Forest products became the largest industry in the county, and expanded greatly when the railroads made it possible to feed the various mills in the area. Work on creating a terminus for the transcontinental railroad in Union came to an abrupt halt with the Panic of 1893, the most serious economic crisis in the nation’s history. Mason County was fortunate, however, in that banker Alfred Anderson partnered with loggers to get them back to work and then with Sol Simpson to create the Simpson Logging Company, which became the largest employer in the state. In the 1980s, the Forest Service eliminated most timber sales to protect the spotted owl.
The prison in Shelton added hundreds of beds during this period, helping to offset job losses in the forest industry. Recreation as well as oyster and seafood production and processing also have increased in importance. Mason County also has become an important community for commuters to Thurston and Pierce counties. In 2020, 55.9 percent of earned income came from residents working outside the county.
Geographic facts
| Mason County | Rank in state | |
| Land area, 2010 (square miles) | 959.42 | 29 |
| People per square mile, 2010 | 63.3 | 15 |
Source: U.S. Census Bureau QuickFacts
Mason County had reduced its unemployment rate levels to those last seen in 2007. However, the return to pre-recession employment totals in some industries had been slow and job creation had become a challenge. Then along came March 2020 and things became a lot more challenging for everyone. Not just Mason County. The county continues to return from the beginning of the pandemic with unemployment rates and nonfarm employment starting to bounce back.
Current labor force and unemployment statistics are available on the Labor area summaries page.
Since 2010 when the unemployment rate touched 11.9 percent, the county had seen a rate drop every year. The COVID-19 outbreak put a pin in that balloon as April 2020 saw the rate jump. While the remainder of the year saw the rate moderate, the damage led to an average annual unemployment rate of 9.8 percent in 2020. Up from the 2019 average of 6.4 percent. The 2021 numbers were a more reasonable 7.0 percent
The labor force has been above 23,000 since 2015 on an average annual basis but has remained below the 25,549 total for 2009. However, the 2021 data did show a slight dip in this metric, averaging 24,903 in comparison to 2009.
Source: Employment Security Department/Data Division
Current industry employment statistics are available on the Labor area summaries page.
Nonfarm industry employment in Mason County has been consistent over the last several years, with most industries remaining steady. However, nonfarm employment totals continue to trail the pre-recession figure of 14,860 in 2007.
The 2021 annual average of 13,450 jobs is 820 fewer jobs than in 2019. The largest industries in the Mason County economy during 2021 were government (5,290) and trade, transportation and utilities (2,440). The manufacturing industry in 2021 accounted for 750 jobs. While the 2021 nonfarm totals represent a negligible decline, the current year will see some bounce back from 2021, with the magnitude of the bounce still in question.
For historical industry employment data, contact an economist.
Source: Employment Security Department/Data Division cb
Industry employment by age and gender
The Local Employment Dynamics (LED) database, a joint project of state employment departments and the U.S. Census Bureau, matches state employment data with federal administrative data. Among the products is industry employment by age and gender. All workers covered by state unemployment insurance data are included; federal workers and non-covered workers, such as the self-employed, are not. Data are presented by place of work, not place of residence.
Mason County highlights:
In 2020, the largest job holder age group in Mason County was the 55 and older age category, making up 26.5 percent of employment across all industries. The next largest share was among people aged 35 to 44 with 21.8 percent of employment.
In 2020, the county’s workers mirrored state patterns with workers aged 14 to 24 dominating the accommodation and food services jobs in the county with 29.6 percent of the positions. This age group was also well represented in arts, entertainment and recreation and retail trade.
Workers in the 55 year and older age category were prevalent in educational services, transportation and warehousing, real estate and rental and leasing and other services.
Females made up 52.2 percent of the labor force in Mason County with males making up the difference at 47.8 percent in 2020. Men were more often represented in higher paying industries:
- Male-dominated industries included agriculture (71 percent), construction (78.4 percent), manufacturing (74.2 percent) and transportation and warehousing (73.3 percent).
- Female-dominated industries included finance and insurance (80.2 percent), health care and social assistance (80.3 percent) and educational services (73.5 percent).
Source: The Local Employment Dynamics
In 2020, there were 13,806 jobs covered by unemployment insurance in Mason County, with a total payroll of nearly $649.5 million.
Mason County’s average annual wage in 2020 was $47,038 below the state’s average of $76,801.
The median hourly wage in 2020 was $22.35, below the state’s median hourly wage of $29.28 and the state excluding King County median hourly wage of $25.01.
Personal income
Personal income includes earned income, investment income and government payments such as Social Security and Veterans Benefits. Investment income includes income imputed from pension funds and from owning a home. Per capita personal income equals total personal income divided by the resident population.
Personal income in 2020 lagged both the state and nation, as Mason County’s per capita personal income was $45,901, less than the state ($67,126) and the nation’s ($59,510).
The median household income in Mason County was $60,565 in 2020. The county’s median was less than the state’s ($77,006) and the nation’s ($64,994).
Over the period 2016 through 2020, 12.6 percent of the Mason County’s population was living below the poverty level, compared with 9.5 percent for the state and the nation at 11.4 percent. The state and national rates are not directly comparable to the county rate because they each use different data sources.
Source: Employment Security Department; Bureau of Labor Statistics; Bureau of Economic Analysis; U.S. Census Bureau; U.S. Census Bureau, American Community Survey
The population of Mason County has increased just under 7,000 since 2010. The largest city is Shelton, with a population of 10,410; the balance of residents are living in unincorporated areas.
Source: Office of Financial Management
Population facts
| Mason County | Washington state | |
| Population 2021 | 67,615 | 7,738,692 |
| Population 2010 | 60,669 | 6,724,540 |
| Percent change, 2010 to 2021 | 11.39% | 15.08% |
Source: Office of Financial Management
Age, gender and ethnicity
Mason County is somewhat older than the statewide average, with fewer individuals under the age of 18 and more 65 and older. The county is less diverse than the state in terms of race and ethnicity, with 87.5 percent white and 1.5 percent black. The American Indian and Alaska Natives make up 4.8 percent of the population.
Demographics
| Mason County | Washington state | |
| Population by age, 2021 | ||
| Under 5 years old | 5.3% | 6.0% |
| Under 18 years old | 19.5% | 21.8% |
| 65 years and older | 23.3% | 15.9% |
| Females, 2021 | 48.1% | 49.9% |
| Race/ethnicity, 2021 | ||
| White | 87.5% | 78.5% |
| Black | 1.5% | 4.4% |
| American Indian, Alaskan Native | 4.8% | 1.9% |
| Asian, Native Hawaiian, other Pacific Islander | 1.7% | 10.4% |
| Hispanic or Latino, any race | 10.6% | 13.0% |
Educational attainment
Most Mason County residents age 25 and older (89.6 percent) were high school graduates, which compares with 91.7 percent of Washington state’s residents and 88.5 percent of U.S. residents in the period 2016 to 2020.
Those with a bachelor’s degree or higher made up 18.1 percent of Mason County residents age 25 and older compared to 36.7 percent of state residents and 32.9 percent of U.S. residents during the same period.
Source: U.S. Census Bureau QuickFacts
Useful links- County data tables
- Census Bureau County Profile
- 2020 Census State Profile
- Mason County on ofm.wa.gov
- Mason County on ChooseWashington.com
- Mason County History
- Mason County Home Page
- U.S. Census Bureau QuickFacts
- Mason County Economic Development Council
- Port of Allyn
- Port of Dewatto
- Port of Grapeview
- Port of Hoodsport
- Port of Shelton
- Shelton-Mason County Chamber of Commerce
- Self Sufficiency Calculator for Washington State
- Workforce Development Areas and WorkSource Office Directory