English | Español
QUICK LINKS
LMI HOMEPAGE
FREQUENTLY USED LINKS
TECHNICAL TOOLS AND STEM
EMPLOYMENT
UNEMPLOYMENT
WAGE
PAID FAMILY AND MEDICAL LEAVE
REPORTS AND RESEARCH
Grant County profile
 by Don Meseck, regional labor economist - updated July 2022
Overview | Geographic facts | Outlook | Labor force and unemployment | Industry employment | Wages and income | Population | Useful link | PDF Profile copy
Regional context
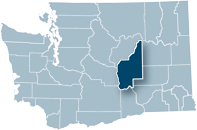
In 1902, Grant County was carved out of Douglas County as its own county. Grant County is the fourth largest county in the state in terms of land area, but is sparsely populated. It is located toward the central-eastern edge of the state in the Columbia Basin. On the north end of the county is the Grand Coulee Dam, which is the largest electric power-producing facility in the United States and one of the largest concrete structures in the world.
Grant County is relatively flat, making it ideal for raising livestock on its dry grassland, which was the primary draw for white settlers in the mid-1880s. The coming of the railroad helped move more settlers into farming as it provided a means to get products to market. The semi-arid climate created a challenge for farming, with most farmers locating near water sources.
Local economy
In years past, Grant County’s economy was heavily concentrated in ranching and agriculture. Many of the county’s early residents were sheep and cattle ranchers. The transition to fruit and crop farming as the dominant industries resulted from the development of adequate irrigation capacity starting in the 1930s. Today, agriculture still plays a large role in the local economy. In 2021, total covered employment countywide was 39,869 of which 9,194 jobs (23.1 percent) were in the agricultural sector. But the importance of Grant County’s agricultural industry expands beyond jobs on the farm or in the orchard. Many trucking and warehousing jobs are dependent on the fortunes of agriculture, as is food processing. In fact, irrigated farming of a variety of crops and the associated food processing industry comprise a large part of the nondurable-goods manufacturing sector. In 2021, food manufacturing (NAICS 311) averaged 2,009 jobs, accounting for 46.7 percent of the 4,301 manufacturing jobs in Grant County. Employers in this sector manufacture frozen fruits and vegetables, as well as frozen specialty foods and canned fruits. Access to Interstate 90 and the Burlington-Northern Santa Fe Mainline make it easy to transport refrigerated goods by truck or rail to major metro centers such as Seattle, Portland and Chicago.
Although agriculture and industries dependent on agriculture are still key players in the Grant County economy, there has been considerable diversification into other sectors. The area’s low-cost electricity; availability of air, rail, and highway transportation networks; abundance of reasonably priced land; and a high-speed fiber optic network have made Grant County attractive to software and manufacturing firms. For example, the following is a summary of the air, rail, and highway transportation networks available in Grant County:
- Grant County International Airport – This airport boasts one of the largest airfields in the United States and can accept the largest aircraft in the world. The airport enjoys 350 days of excellent Visual Flight Rules (VFR) weather and is regularly utilized by military and commercial test flight programs.
- Rail – Rail needs are served by both The Burlington Northern Santa Fe (BNSF) and the Columbia Basin Railroad (CBRR). The mainline of the BNSF has connections to the Chicago area from Quincy in as little as 48 hours. New rail is arriving at the Port of Moses Lake via the CBRR where Foreign Trade Zone #203 supports numerous manufacturers.
- Highways – Running right through the center of Grant County, Interstate 90 is the longest interstate highway in the United States. It connects Grant County to the deep seaports in Seattle and Tacoma to the west, and to Chicago and Boston to the east. U.S. Highway 2 is the other major east/west transportation route in Grant County. It spans over 2,500 miles and connects Grant County to Everett, WA on the west and to St. Ignace, MI on the east. State Highway 17 is the main north/south transportation route.
| Grant County | Washington state | |
| Land area, 2020 (square miles) | 2,679.6 | 66,455.1 |
| People per square mile, 2020 | 37.0 | 115.9 |
Source: U.S. Census Bureau QuickFacts
Current Employment Statistics (CES) data show that, year over year, total nonfarm employment in Grant County expanded in each of the past 14 months (April 2021 through May 2022). Local Area Unemployment Statistics (LAUS) data show that the local Civilian Labor Force (CLF) has expanded in each of the past 12 months (June 2021 through May 2022). However, it is uncertain how long this economic resurgence will last. Much depends on whether the COVID-19 virus can be contained and/or eradicated. The effect of rising interest rates on national and local labor markets are also a concern. Nevertheless, staff in the DATA Division of the Washington State Employment Security Department (ESD) have prepared long-term (i.e., 10-year) industry employment projections indicating a 0.1 percent average annual nonfarm growth pace from 2019 to 2029 for the five-county (Adams, Chelan, Douglas, Grant and Okanogan) North Central Workforce Development Area (WDA), and a 0.4 percent growth rate for Washington state during this timeframe.
Current labor force and unemployment statistics are available on the Labor area summaries page.
The National Bureau of Economic Research (NBER) announced that the recent national Great Recession occurred from December 2007 through June 2009; however, the effects of this recession hit Grant County and Washington state labor markets primarily in 2010. Grant County’s unemployment rate reached 10.9 percent in 2010, while Washington state’s unemployment rate also reached an apex of 10.0 percent in 2010. Unemployment rates reached 8.8 percent in Grant County and 8.5 percent across Washington State in 2020, due to COVID-19-related layoffs, but these rates were still lower than during the Great Recession.
Grant County averaged 46,989 residents in the CLF in 2020 and 47,859 in 2021, a 0.8 percent expansion. Year over year, the local CLF has expanded in each of the past 11 months (June 2021 through May 2022). This May, there were 592 more residents in the labor force than in May 2021, a 1.3 percent upturn. Also, estimates indicate a slightly more rapid resident employment growth pace of 2.0 percent between May 2020 and May 2021, faster than the CLF growth rate of 1.3 percent during this period. This could indicate that a greater proportion of employed residents commuted or teleworked to jobs outside of Grant County. Finally, the number of unemployed dropped by 294 (down -10.3 percent); from 2,865 residents in May 2021 to 2,571 in May 2022. This decrease in the number of unemployed, combined with the 1.3 percent increase in the labor force, caused Grant County’s unemployment rate to decline to 5.5 percent in May 2022 from the 6.2 percent reading in May 2021 – a step forward for the local economy. Another step forward is that the number of residents in Grant County’s CLF this May (47,045) was 0.5 percent greater than the 46,804 residents in the labor force in May 2019 (prior to the COVID-19 pandemic) indicating a modest labor force recovery.
Source: Employment Security Department
Current industry employment statistics are available on the Labor area summaries page.
The analysis in the first part of this section is derived primarily from Quarterly Benchmarked (WA-QB) data. One advantage of these data is that the employment information is very current and data are updated monthly using WA-QB employment estimates. However, estimates are nonfarm related (i.e., they do not include agricultural employment figures).
The analysis in the second part of this section is derived from the Bureau of Labor Statistics’ (BLS) Quarterly Census of Employment and Wage (QCEW) program, conducted by the Washington State Employment Security Department. Although it takes a little longer to acquire QCEW data (than WA-QB data), the economic information provided is broader and more detailed than that provided by WA-QB.
First, QCEW includes employment, wage and size of firm figures for the agricultural sector, which WA-QB does not include. Second, QCEW data provides employment, wage and size of firm figures for businesses and government organizations in Grant County down to the three-digit NAICS sub-sector level (i.e., more detail than WA-QB). QCEW data include agricultural and nonagricultural employment and wages for firms, organizations and individuals whose employees are covered by the Washington State Employment Security Act. Also included are data for Federal Government agencies covered by Title 5, U.S.C. 85. Covered employment generally exceeds 85 percent of total employment in the state of Washington.
Types of jobs not covered under the unemployment compensation system, and hence not included in QCEW data, include casual laborers not performing duties in the course of the employer’s trade or business; railroad personnel; newspaper delivery people; insurance or real estate agents paid on a commission basis only; non-covered employees working for parochial schools, religious, or non-profit organizations; employees of sheltered workshops; inmates working in penal institutions; non-covered corporate officers; etc.
Analysis using quarterly benchmarked data:
The National Bureau of Economic Research (NBER) announced that the national recession occurred from December 2007 through June 2009. The effects of this recession hit the Grant County nonfarm economy lightly in 2008 (down 0.2 percent), hard in 2009 (down 3.7 percent) and then lightly in 2010 (down 0.3 percent) as the number of nonfarm jobs tumbled from the pre-recession peak of 27,610 jobs in 2007. Basically, it took seven years (until 2014 when employment averaged 28,650) for the local economy to regain and surpass this figure. The Grant County job market continued this upward trajectory through 2019 when nonfarm employment registered 30,850 jobs. Following is a brief synopsis of average annual local nonfarm employment trends for the past three completed calendar years:
- In 2019 – Grant County's averaged 30,850 nonfarm jobs. The labor market provided 80 more jobs than in 2018 for a modest average annual increase of 0.3 percent, less robust than the state’s 2.0 percent job growth rate in 2019. Local industries which fared well in 2019 were leisure and hospitality (up 150 jobs and 5.7 percent) and education and health services (up 90 jobs and 3.1 percent). Conversely, manufacturing retrenched countywide (down 200 jobs and -4.2 percent).
- In 2020 – This was a dismal year for the Grant County economy due to COVID-19-related layoffs. Nonfarm employment averaged just 30,360, a 490 job and -1.6 percent downturn below the 30,850 jobs tallied in 2019. Nonfarm job growth was strong in mining, logging, and construction (where the lion’s share of employment is in the local construction industry) which netted 240 new jobs (up 16.2 percent). However, state and local government education lost 320 jobs (-8.5 percent) and durable goods manufacturers saw the number of jobs shrink by -17.0 percent. Statewide, the nonfarm labor market was hit relatively harder, tumbling by -5.4 percent between 2019 and 2020.
- In 2021 – Grant County's nonfarm economy netted 670 new jobs (up 2.2 percent) in 2021 rising from 30,360 to 31,030 jobs, - a bit less robust than Washington’s 2.5 percent job growth rate. The local leisure and hospitality sector (primarily hotels, eating and drinking places, and amusement and recreation services) rebounded by 230 jobs (up 9.5 percent) while retail trade increased by 130 (3.8 percent).
Nonfarm employment in Grant County has expanded year over year in each of the past 14 months (April 2021 through May 2022). Recent estimates indicate that nonfarm employment countywide elevated by 1.3 percent, from 30,910 jobs in May 2021 to 31,320 jobs in May 2022.
Analysis using QCEW data:
The North American Industry Classification System (NAICS) is an industry classification system that groups businesses/organizations into categories or sectors based on the activities in which they are primarily engaged. There are 19 private sectors and three government sectors (for a total of 22 sectors) at the two-digit NAICS code level, within each county-level economy. One can observe much about the structure of a county’s economy by quantifying and comparing the number of jobs and the percentage of jobs in these sectors by using average annual QCEW data. The most current average annual employment data available for Grant County are for 2021, and these data show:
The top five Grant County industry sectors in 2021 in terms of employment were:
| Sector | Number of jobs | Share of employment |
| 1. Agriculture, forestry and fishing | 9,194 | 23.1% |
| 2. Local government | 6,847 | 17.2% |
| 3. Manufacturing | 4,301 | 10.8% |
| 4. Retail trade | 3,574 | 9.0% |
| 5. Health Services | 2,895 | 7.3% |
| All other industries | 13,058 | 32.8% |
| Total covered payrolls | 39,869 | 100% |
Over two-thirds (67.2 percent) of all jobs in Grant County were in five, two-digit NAICS industries or sectors (agriculture, local government, manufacturing, retail trade and health services). Hence, the Grant County economy is not very diversified – like many other agriculturally based economies here in Central Washington (Adams, Chelan, Douglas, Kittitas, Okanogan and Yakima counties, etc.).
Covered employment trends over the last 10 years (from 2011 through 2021) were analyzed using ESD’s average annual QCEW data for the 22 two-digit NAICS sectors in Grant County. Total covered employment countywide tallied 35,186 jobs in 2011 and 39,869 in 2021, a 13.3 percent upturn and an annualized growth rate of 1.3 percent. Following are some findings that reference sectors gaining relatively large numbers of jobs during this period:
- The sector which grew at the fastest pace, and which added the second-highest number of jobs in Grant County between 2011 and 2021 was professional and business services (NAICS 54). This sector is also referred to as professional, scientific, and technical services (i.e., legal and accounting services; architectural, engineering, and related services; computer systems design; management, scientific, and technical consulting services; etc.). This sector netted 861 more jobs countywide in 2021 (1,214 jobs) than in 2011 (353 jobs), a dramatic 243.9 percent increase, yielding an annualized growth rate of 13.1 percent. The Grant County Economic Development Council’s website lists several local aerospace firms which either directly or indirectly employ personnel working for professional and business services companies (i.e., AeroTEC, Aviation Technical Services, Boeing, Columbia Pacific Aviation, Greenpoint Technologies, Million Air, and Sonico Inc.).
- The number of agricultural jobs in Grant County rose slightly from 8,891 in 2011 to 9,194 in 2021, a modest 303 job and a 3.4 percent uptrend, with annualized employment growth between 2011 and 2021 of 0.3 percent. In 2011, Grant County’s agricultural industry accounted for 25.3 percent of total covered employment, but by 2021, agricultural employment accounted for just 23.1 percent of total covered employment. Hence, the relative share of agricultural employment dipped by 2.2 percentage points (from 25.3 to 23.1 percent) during this recent 10-year period. This is not to say that the agricultural industry is not a “bedrock” to the Grant County economy. It still is. In fact, the National Agricultural Statistics Service (NASS) 2017 Census of Agriculture (county profile for Grant County) stated that 20.0 percent of Washington state’s agricultural sales (with a market value of $1.94 billion) were generated in Grant County. Nevertheless, the number of agricultural jobs actually “peaked” countywide in 2014 at 10,658 jobs (27.4 percent of total covered employment) and generally declined in each of the next seven years (from 2015 through 2021, inclusively). There are at least three possibilities for this slow and steady seven-year decline in agricultural employment countywide: automation, the gradual conversion of some seasonal agricultural jobs to year-round positions, and the increased use of H-2A agricultural labor.
- Between 2011 and 2021, the Grant County sector that gained the most jobs was private health services (also called health care and social assistance). In 2021, QCEW data indicate that health services (i.e., ambulatory health care, nursing home and assisted living facilities, and social services) tallied 2,895 jobs, or 7.3 percent of covered employment countywide. In 2011, health services tallied 1,850 jobs in Grant County but accounted for only 5.3 percent of total covered employment. However, health services (NAICS 62) averaged 1,798 jobs countywide in 2013 versus 2,714 jobs in 2014 – a “remarkable” 916 job and 50.9 percent increase. This health services employment “surge” was administratively mandated by the NAICS reclassification of private household employment and wages (NAICS 814) into services for the elderly and disabled (NAICS 624) in first quarter 2014 – as directed by the federal Bureau of Labor Statistics (BLS). A better analysis of recent health services job trends in Grant County is derived by comparing average annual employment in 2014 (2,714 jobs) with 2021 (2,895 jobs), a 181 job and 6.7 percent advance in this seven-year period (2014 to 2021, inclusively).
For historical industry employment data, contact an economist.
Source: Employment Security Department
Industry employment by age and gender
The Local Employment Dynamics (LED) database, a joint project of state employment departments and the U.S. Census Bureau, matches state employment data with federal administrative data. Among the products is industry employment by age and gender. All workers covered by state unemployment insurance data are included; federal workers and non-covered workers, such as the self-employed, are not. Data are presented by place of work, not place of residence.
Grant County highlights:
In 2020, the largest job holder age group was the 55+ year-olds who accounted for 26.0 percent of all job holders in Grant County. The group in second place was the 35 to 44-year-olds filling 21.3 percent of all jobs. In third place was the 25 to 34-year-olds with 20.4 percent of all local jobs.
Males held 54.0 percent of all jobs and females held 46.0 percent of all jobs countywide in 2020.
- Male-dominated industries included mining (96.1 percent), construction (83.3 percent) and transportation and warehousing (78.4 percent).
- Female-dominated industries included health care and social assistance (79.2 percent), educational services (72.5 percent) and finance and insurance (68.9 percent).
Source: The Local Employment Dynamics
The total covered payroll in 2021 in Grant County was approximately $2.09 billion. The average annual wage was $52,303 or 63.4 percent of the state average of $82,513.
The top five Grant County industries in 2021 in terms of payrolls were:
| Sector | Payroll | Share of payrolls |
| 1. Local government | $447,782,504 | 21.5% |
| 2. Agriculture, forestry and fishing | $319,893,589 | 15.3% |
| 3. Manufacturing | $257,550,838 | 12.4% |
| 4. Professional and business services | $148,681,643 | 7.1% |
| 5. Health services | $130,184,588 | 6.2% |
| All other industries | $781,182,677 | 37.5% |
| Total covered payrolls | $2,085,275,839 | 100% |
As shown in the table above, QCEW data showed that Grant County’s workers received nearly $2.09 billion in wages in 2021. Approximately 62.5 percent of this total wage income/payroll was earned in five, two-digit NAICS industries or sectors (local government, agriculture, manufacturing, professional and business services, and health services). Local government was the largest provider of wage income and payroll in the county in 2021, supplying 21.5 percent of total earned wage income and accounting for 17.2 percent total covered employment (see “Industry employment” section). Agriculture, forestry and fishing ranked second in 2021 in terms of share of total covered payroll, providing 15.3 percent of all wages earned in Grant County – with the lion’s share of these wages being earned in the agricultural industry (versus forestry and fishing).
Covered wage trends over the last 10 years (from 2011 through 2021) were analyzed using the ESD’s average annual QCEW data for the 22 two-digit NAICS sectors in Grant County. Total covered wages countywide tallied approximately $1.18 billion in 2011 and $2.09 billion in 2022, a 76.3 percent upturn (not adjusted for inflation) and an annualized growth rate of 5.8 percent. The following are some findings that reference two sectors which ranked number 1 and number 2 in terms of payroll growth (in dollars) between 2011 and 2021:
- The sector which registered the highest payroll growth (in dollars) in Grant County between 2011 and 2021 was local government. This category saw earned wage income rise by $167.1 million, from $280.7 million in 2011 to $477.8 million in 2021, a pronounced 59.5 percent increase. Local government includes a diverse array of agencies/organizations at the city and county levels such as local public schools, public hospitals and clinics, police and fire departments, courts, libraries, roads crews, public utility districts, etc.
- Between 2011 and 2021, the Grant County sector which ranked number 2 in terms of payroll growth was professional and business services (NAICS 54). This sector includes business which provide legal and accounting services; architectural, engineering, and related services; computer systems design; management, scientific, and technical consulting services; etc.). In 2011, QCEW data indicate there were only 353 jobs in this sector with wage income totaling $12.7 million. Ten years later, in 2021, professional and business services employers provided 1,214 jobs across Grant County with wages totaling $148.7 million, an astounding payroll jump of 1,070.8 percent (up $136.0 million).
Average annual covered wages in Grant County during 2021 were highest in information ($154,871), professional and technical services ($122,473) and management of companies and enterprises ($103,961). Conversely, average annual wages were lowest in private educational services ($19,111), accommodation and food services ($21,806), and arts, entertainment, and recreation ($27,454).
Source: Employment Security Department; Bureau of Labor Statistics; Bureau of Economic Analysis; U.S. Census Bureau;
U.S. Census Bureau, American Community Survey
Personal income
Personal income includes earned income, investment income, and government payments such as Social Security and Veterans Benefits. Investment income includes income imputed from pension funds and from owning a home. Per capita personal income equals total personal income divided by the resident population. In 2020, Grant County inflation-adjusted per capita personal income was $48,468, less than the state ($67,126) and the nation ($59,510).
According to the U.S. Census Bureau QuickFacts, the median household income in Grant County was $59,165 in the period 2016 through 2020. The county’s median was less than the state ($77,006) and the nation ($64,994).
In the period 2016 through 2020, 13.6 percent of the county’s population was living below the poverty level, higher than the state at 9.5 percent and the nation at 11.4 percent, according to the U.S. Census Bureau QuickFacts. The state and national rates are not directly comparable to the county rate because they each use different data sources.
Grant County’s population in 2021 was 100,297. The population grew 1.2 percent from April 1, 2020, through July 1, 2021 – faster than the state’s 0.4 percent growth rate during this timeframe.
Moses Lake is the largest city in the county with an estimated population in 2021 of 25,760 residents. Ephrata is the next largest city with 8,575 residents.
Population facts
| Grant County | Washington state | |
| Population 2021 | 100,297 | 7,738,692 |
| Population 2020 | 99,123 | 7,705,281 |
| Percent change, 2020 to 2021 | 1.2% | 0.4% |
Source: U.S. Census Bureau QuickFacts
Age, gender and ethnicity
Individuals under 18 years of age comprise 29.0 percent of Grant County’s population, which is greater than the 21.7 percent proportion across Washington state as of July 2021. People under 5 years of age comprised 7.2 percent of the county population compared to 5.6 percent for the state.
Hispanics or Latinos made up 43.1 percent of the local population, considerably higher than the 13.7 percent figure statewide.
Source: U.S. Census Bureau QuickFacts
Demographics
| Grant County | Washington state | |
| Population by age, 2020 | ||
| Under 5 years old | 7.2% | 5.6% |
| Under 18 years old | 29.0% | 21.7% |
| 65 years and older | 14.3% | 16.2% |
| Females, 2020 | 48.8% | 49.6% |
| Race/ethnicity, 2020 | ||
| White alone | 91.3% | 77.5% |
| Black alone | 2.0% | 4.5% |
| American Indian, Alaskan Native | 2.6% | 2.0% |
| Asian | 1.2% | 10.0% |
| Native Hawaiian or Other Pacific Islander | 0.3% | 0.8% |
| Two or more races | 2.6% | 5.2% |
| Hispanic or Latino, any race | 43.1% | 13.7% |
| White alone, not Hispanic or Latino | 52.1% | 66.0% |
Source: U.S. Census Bureau QuickFacts
Educational attainment
According to the American Community Survey (ACS), during the period 2016 through 2020, 78.5 percent of Grant County’s adults age 25 and older graduated from high school versus Washington’s 91.7 percent and 88.5 percent across the nation.
Only 18.0 percent of county residents age 25 and older hold a bachelor’s degree or higher compared with 36.7 percent in Washington state and 32.9 percent nationwide.
Source: U.S. Census Bureau QuickFacts
- County data tables
- Census Bureau County Profile
- 2020 Census State Profile
- Grant County Economic Development Council
- Grant County home page
- Grant County on ChooseWashington.com
- Grant County on ofm.wa.gov
- Grant County History
- Self Sufficiency Calculator for Washington State
- Census Bureau QuickFacts
- Port of Ephrata
- Port of Mattawa
- Port of Moses Lake
- Port of Quincy
- Port of Warden
- Washington Ports
- Workforce Development Areas and WorkSource Office Directory