English | Español
QUICK LINKS
LMI HOMEPAGE
FREQUENTLY USED LINKS
TECHNICAL TOOLS AND STEM
EMPLOYMENT
UNEMPLOYMENT
WAGE
PAID FAMILY AND MEDICAL LEAVE
REPORTS AND RESEARCH
Garfield County profile
 by Ajsa Suljic, regional labor economist - updated June 2022
Overview | Geographic facts | Outlook | Labor force and unemployment | Industry employment | Wages and income | Population | |Useful links | |PDF Profile copy
Regional context
Garfield County was formed from the eastern portion of Columbia County by an act of the Washington Territorial Legislature in 1881. Garfield County is bordered by Whitman County on the north, Asotin County on the east, Columbia County on the west and on the south by Wallowa County, Oregon. The Snake River makes up its northern and northeastern borders and is an essential part of its economic existence.
Garfield County is the seventh-smallest county in the state, with only 710.5 square miles. Before white exploration and settlement, the semi-nomadic Nez Perce inhabited the area on both sides of the Nez Perce Trail as means of commerce, which was of strategic importance to the development of the region.
The establishment of the territory and the end of the Indian Wars resulted in an influx of white settlers into the county. Garfield County settlers came and started farming and ranching in the area. Later some settlers started communities in the Pataha Creek area, today’s Pomeroy City, with the first known commercial establishment being a stage station and “eating house” (shaver). By 1875, there was an estimated 200 farms in the area, which produced major crops of pears, wheat, blue grass and others. Garfield County is the least populated county in the state of Washington, ranking 39th among 39 Washington counties, with a population of 2,346 people in 2021, or 3.2 per square mile.
Local economy
The Garfield County workforce is employed primarily in government services (around 68.5 percent in total). While local government makes up the biggest share of that employment, which includes local education services, federal government employment is very significant for the area by providing stable and higher paying jobs.
Farmland occupies over two-thirds of the county’s total land usage. The main crop is dry land wheat. The total value of agricultural sales tends to be in the same range as the total wages earned for the county.
As of the 2017 Agricultural Census, the county had 226 farms with an average size of 1,283 acres. The number of farms increased by 7.0 percent from the 2012 Census. The market value of agricultural products sold was $37.2 million, with 86.0 percent of that being from crop sales and 14.0 percent from livestock, poultry, and other products. About 36.0 percent of farms in Garfield County have a value of crop sales over $100,000. Main crops in Garfield County include all types of wheat for grain, barley for grain, chickpeas, canola and forage. The largest livestock inventory are cattle and calves. Only 34.0 percent of Garfield farms hire farm labor, and 92.0 percent of all farms are family farms.
Demographics also play a role in Garfield County’s economy, as a high proportion of elderly residents continue to increase demand for local health care services, which in this county are mostly provided by the government sector. Health care and social services are projected to grow at a faster than average rate.
| Garfield County | Rank in state | |
| Land area, 2010 (square miles) | 710.69 | 33 |
| People per square mile, 2019 | 3.2 | 39 |
Source: Washington State Office of Financial Management
Garfield County’s employment has been in a decline trend since 2011. Since the recession of 2007, covered employment has not recovered and continues its downward trend with a new 10-year low in 2020. This puts a lot of strain on the economic well-being of this small rural county.
Wholesale trade and retail trade will continue to be the cluster that provides the most private sector jobs. Major agricultural commodities will remain in production if there is sufficient demand and proper weather conditions. Government employment is the leading employing industry and the only one that has shown stability; however, it has decreased in employment over the past year.
The Columbia Pulp project in nearby Starbuck, Columbia County contributed to more resident employment stability, as well as availability of work throughout 2020.
Current labor force and unemployment statistics are available on the Labor area summaries page.
In 2021, the county labor force was estimated at 839, with an increase of 2.9 percent over the year. The number of people employed was estimated at 791, while about 48 people were estimated to be unemployed and looking for work. Resident employment continued to increase over the year, while the number of people looking for work found employment and entered the labor force.
Unemployment was down to 5.7 percent in 2021 from 8.5 percent in 2020. Yearly averages in the labor force show some volatility, which is associated with the government and seasonal agricultural economic base.
The average annual unemployment rate in Garfield County in 2008 was the lowest in 14 years, at 4.9 percent before it peaked again in 2010 at 8.3 percent. In 2020, Garfield County unemployment rate reached the new low in November of 2021 of 4.5 percent, making this the lowest unemployment rate in the county’s history. The unemployment rate fluctuates throughout the year, reflecting the seasonal employment, with lows in September or October each year and peaks in January or February.
Source: Employment Security Department
Current industry employment statistics are available on the Labor area summaries page.
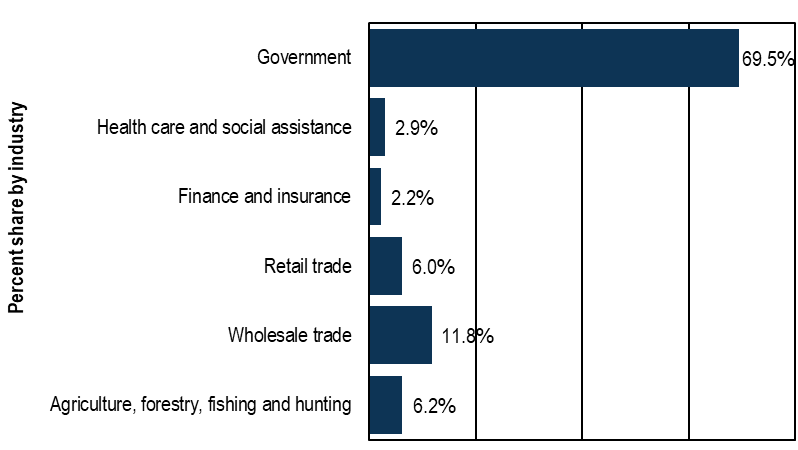
Garfield County’s average covered employment was 645 in 2020, a 2.3 percent decrease over the year. Garfield County had an annual decrease of 1.8 percent for the past ten years. Almost all employment in Garfield County is in service-providing industries, specifically government employment at 69.7 percent of the total. Total covered payrolls were at $34.2 million in 2020, up by 3.3 percent over the year.
- Goods-producing industries in Garfield County provided around 40 jobs. Most of the employment in this segment was in agriculture. Agriculture employment keeps its regular cycle employment fluctuation with 2020 being one of the low employment years with close to 40 jobs. Agriculture is slated to keep changing its employment structure with innovation and automation in the cultivating and harvesting of crops.
- Service-providing industries averaged 605 jobs in 2020, a decrease of 2.6 percent from 621 in 2019. This industry cluster is made up of multiple industries serving both population and business in the county. This is the major cluster that continues to provide jobs to the local community.
- Garfield County service-providing employment is 69.5 percent in government, 19.0 percent in trade, transportation and utilities, 2.3 percent in information and financial activities and 1.8 percent in private health care and social assistance.
- Government employment averaged 448 in 2020, decreased over the year by 2.1 percent, with main employment being in local government and the second-highest employment being in federal government.
Garfield County employment share by industry, 2020
For historical industry employment data, contact an economist.
Source: Employment Security Department/QCEW
Industry employment by age and gender
The Local Employment Dynamics (LED) database, a joint project of state employment departments and the U.S. Census Bureau, matches state employment data with federal administrative data. Among the products is industry employment by age and gender. All workers covered by state unemployment insurance data are included; federal workers and non-covered workers, such as the self-employed, are not. Data is presented by place of work, not place of residence. Some highlights:
The largest job holder group in Garfield County in 2020 was the 55 to 64 years of age group with 20.4 percent of the workforce. The second-largest share on the labor force is 35 to 44 years of age group. The workforce has aged over the years, and now 40.0 percent of the workforce is between 45 and 64 years old.
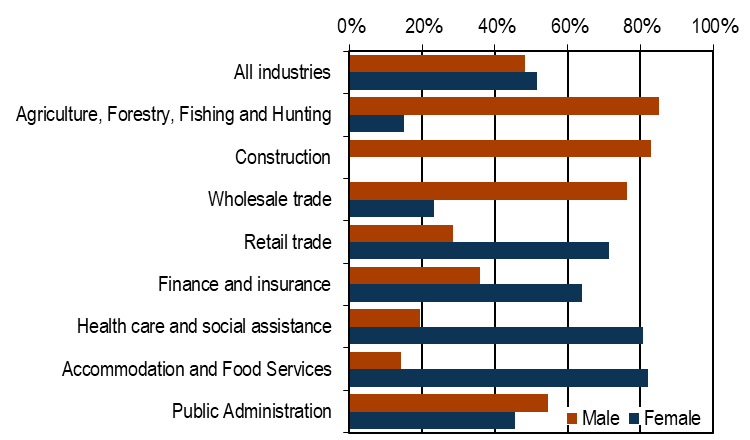
The Garfield County workforce was mostly male in 2020; 51.7 percent of all industry jobs were held by men and 48.3 percent were held by women. Industry differences are discussed below:
- Male-dominated industries included agriculture (85.0 percent), construction (83.0 percent), wholesale trade (76.2 percent), and public administration (54.5 percent).
- Female-dominated industries included accommodation and food services (82.1 percent), health care and social assistance (80.7 percent), finance and insurance (64.0 percent) and retail trade (71.4 percent).
Percent of industry jobs by gender, Garfield County, 2020
Source: The Local Employment Dynamics
In 2020, Garfield County had 645 jobs covered by unemployment insurance, with a total payroll of over $34.2 million.
The county average annual wage was $53,012 in 2020, which is well below the state’s average annual wage of $73,504, or the state, less King County, of $50,834. In 2020, Garfield County was ranked 14th in the state for average annual wages among 39 counties.
The Garfield County median hourly wage was $23.59 in 2020, which was well below the state’s median hourly wage of $29.28 and below the state, less King County, median wage of $25.01.
Personal income
Personal income includes earned income, investment income, and government payments such as Social Security and Veterans Benefits. Investment income includes income imputed from pension funds and from owning a home. Per capita personal income equals total personal income divided by the resident population.
In 2020, per capita income in Garfield County was $57,967, with an increase over the year of 14.9 percent. Nonetheless, income was well below the state’s per capita income of $67,126 and the national income of $59,510, according to Bureau of Economic Analysis.
Median household income over the period of 2020 was $56,923, well below the state’s $77,006 or national median household income of $64,994, according to the U.S. Census Bureau QuickFacts.
In the year of 2020, 11.4 percent of the population was living below the poverty level in Garfield County. This compares to the state at 9.5 percent and the nation at 11.4 percent.
Source: Employment Security Department; Bureau of Labor Statistics; Bureau of Economic Analysis; U.S. Census Bureau;
U.S. Census Bureau, American Community Survey
According to the Census estimates for 2021, Garfield County’s population was 2,346. Garfield County’s population increased by 3.5 percent from 2010 to 2021. This county continues to age out and younger populations leave for other opportunities elsewhere.
The Garfield County seat and the largest city is Pomeroy with a population of 1,389 in 2020. The second notable city is Pataha City.
Source: U.S. Census Bureau
Population facts
| Garfield County | Washington state | |
| Population 2021 | 2,346 | 7,738,692 |
| Population 2010 | 2,266 | 6,724,540 |
| Percent change, 2010 to 2021 | 3.5% | 15.1% |
Source: U.S. Census Bureau QuickFacts
Age, gender and ethnicity
Garfield County has a large retirement age community with 25.3 percent of the population being 65 years of age or older.
- Garfield County’s population age 65 and older was 25.3 percent in 2020 compared to the state’s 15.9 percent.
- Those under 18 years of age made up 21.0 percent in 2020 compared to the state’s 21.8 percent.
- The youngest age group, those under 5 years of age, was 7.5 percent in 2020, compared to the state’s 6.0 percent.
Females made up 51.2 percent of the county’s population, which is slightly above the state’s 49.9 percent.
Diversity in the county shows that 88.1 percent of residents are white alone not Hispanics or Latino, with 5.6 percent of Hispanic or Latino origin, compared to the state’s 67.5 percent and 13.0 percent, respectively.
Source: U.S. Census Bureau QuickFacts
Demographics
| Garfield County | Washington state | |
| Population by age, 2020 | ||
| Under 5 years old | 7.5% | 6.0% |
| Under 18 years old | 21.0% | 21.8% |
| 65 years and older | 25.3% | 15.9% |
| Females, 2020 | 51.2% | 49.9% |
| Race/ethnicity, 2020 | ||
| White alone, not Hispanic or Latino | 88.1% | 67.5% |
| Black | 0.1% | 4.4% |
| American Indian, Alaskan Native | 0.7% | 1.9% |
| Asian, Native Hawaiian, other Pacific Islander | 3.2% | 10.4% |
| Hispanic or Latino, any race | 5.6% | 13.0% |
Source: U.S. Census Bureau, QuickFacts
Educational attainment
In the period 2016 to 2020, 95.5 percent of individuals age 25 and older were high school graduates, which is higher than that of Washington state (91.7 percent).
Over the same period, it’s estimated that 25.7 percent of people in Garfield County 25 and older have attained a bachelor’s degree or higher. This figure does not compare favorably with the state (36.7 percent).
Source: U.S. Census Bureau, QuickFacts
- County data tables
- Census Bureau County Profile
- 2020 Census State Profile
- Garfield County on ofm.wa.gov
- Garfield County History
- Garfield County home page
- Port of Garfield
- U.S. Census Bureau QuickFacts
- Self Sufficiency Calculator for Washington State
- Southeast Washington Economic Development Association